
Many of the marketing guides and articles you see every day are based on nothing but the author’s subjective opinion.
So how do you separate email marketing facts from opinions? That’s right, numbers.
Numbers speak louder than words, and email marketing stats speak even louder. That’s why we at Snov.io have collected the most useful and striking B2B email marketing statistics you should know about in 2024.
Outline:
Is email marketing overrated?
Email is being questioned as a marketing channel every year. And yet the numbers show that it is stronger than ever.
In 2023, an average of 347.3 billion emails are sent and received per day—a 4.3% increase from the previous year, and it’s forecasted to increase further by a similar margin in 2024, hitting 361.6 billion.
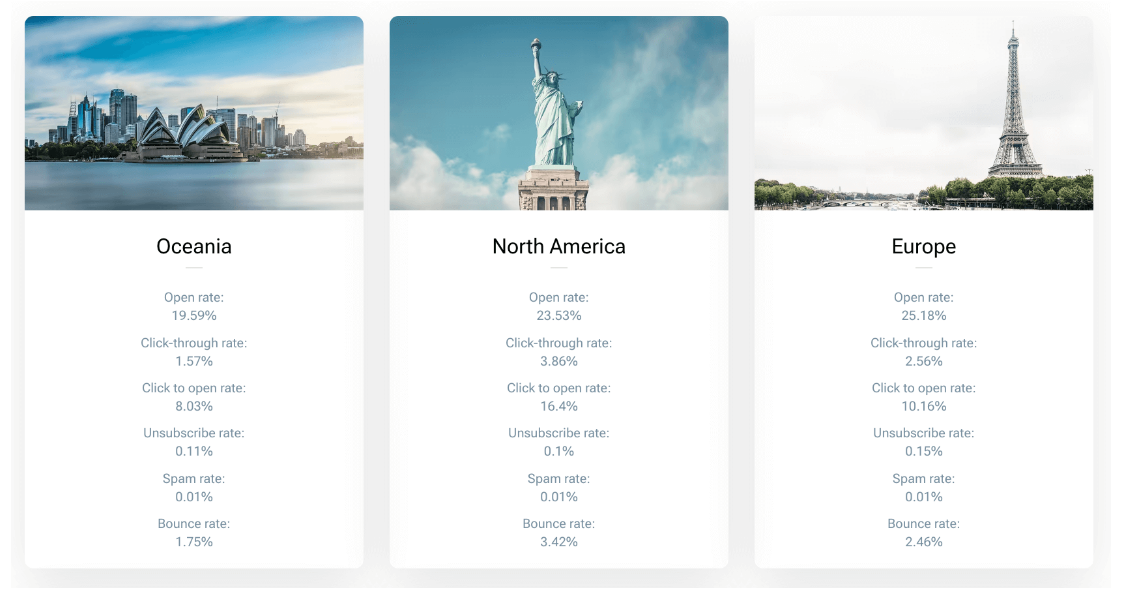
In 2022, the average open rate was 19.66%.
22% of marketers report email click-through-rates over 20% as opposed to industry average of 10.69%.
Meanwhile, the average click-to-open rate was 10.5%.
The average unsubscribe rate for 2022 was 0.1%.
The spam rate average in 2022 was 0.02%.
The average email bounce rate across all industries was 2.76%.
On average, a good response rate to aim for is 10%.
77% of B2B buyers prefer to be contacted over email – more than double any other channel.
In Europe, North America, and APAC, email marketing is the most widely used technology for customer engagement – 77.6% (compared to 62% produced by content management and 61% shown by social media).
29% of marketers rate email marketing as the most effective marketing channel (25% for social media, 22% for SEO, and 25% for content marketing).
87% of B2B marketers use email channel for distributing content.
31% of marketers use email newsletters as a top channel to nurture leads.
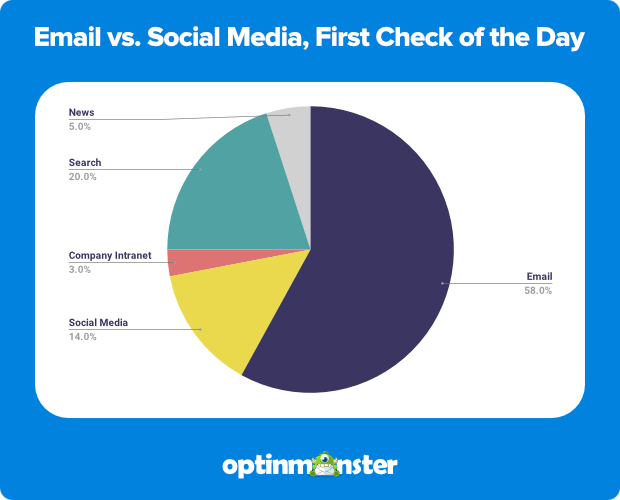
- Email is the first check of the day for 58% of users.
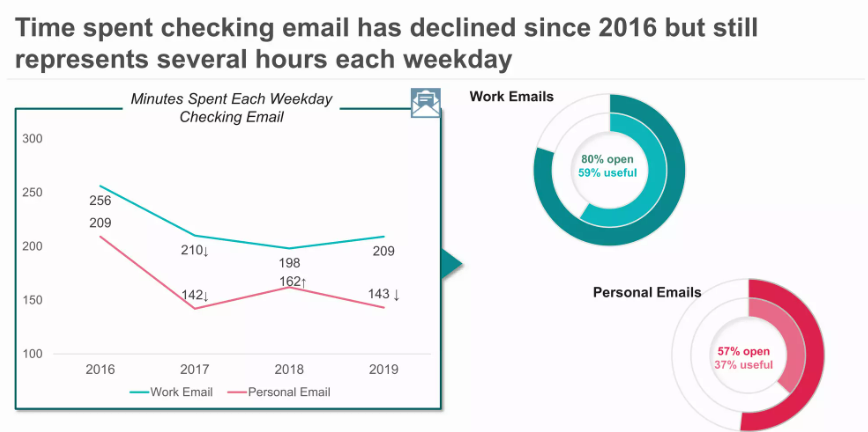
- 5 hours a day are spent checking email (work+personal).
Importance of email marketing in 2024
So why is email marketing so popular? Email marketing = ROI. It can be used for multiple purposes, and it converts! The stats below prove it:
Email generates $36 for every $1 spent, meaning email marketing ROI is 3600%.
18% of companies achieve email marketing ROI greater than $70 per $1 invested.
59% of marketers believe email is over twice as effective at generating leads than channels such as PPC and paid social media.
Email marketing acquired 40 times more customers than Facebook and Twitter combined with the average click-through rates for each channel:
– email marketing (3.57%)
– Facebook (0.07%)
– Twitter (0.03%)
Email marketing comes in second, followed by content marketing and paid media, ranked as the top four opportunities for developing brand awareness for small businesses.
40% of B2B marketers claim that email newsletters are the most important tactic in their content marketing strategy.
37% of respondents name email as the most effective channel for customer loyalty and retention, while websites were named by 13% and social media by only 11%.
Email marketing (84%) is the most implemented marketing tactic in B2B business, followed by:
– social media & social media advertising (75%),
– blogging & content marketing (69%),
– SEO (60%),
– tradeshows & events (54%).
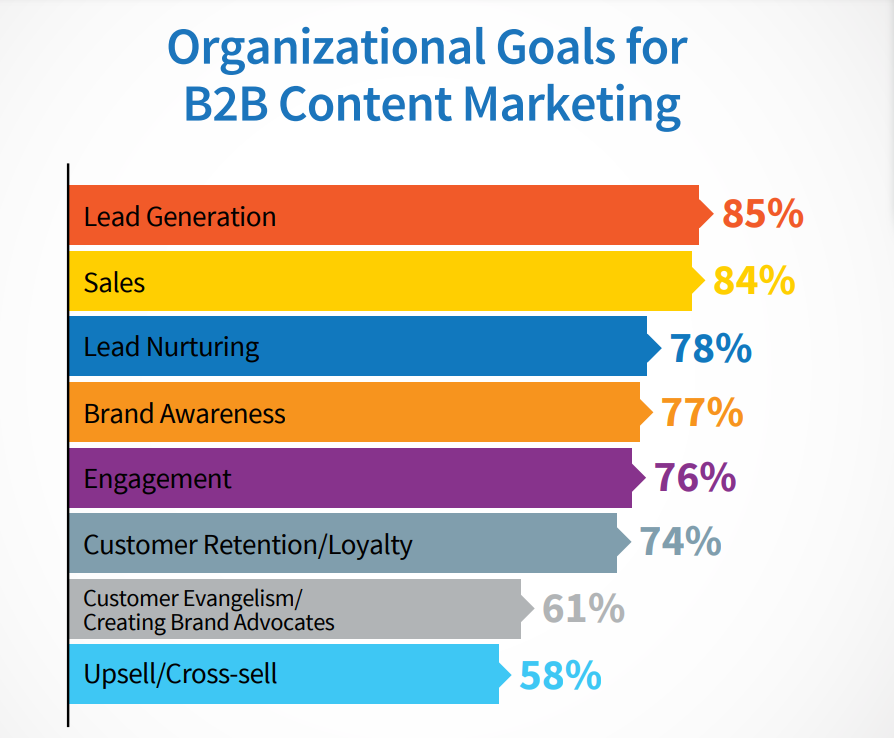
Email marketing is mostly used for lead generation (85%), sales (84%), lead nurturing (78%), and customer retention (74%).
Email frequency and timing
When it comes to converting, one needs to know the best time to send email. And email marketing statistics have a thing or two to say about the perfect email frequency and sending time.
61% of subscribers/customers would like to receive promotional emails every week, 38% – more frequently.
Marketers get in touch with their clients (per month): 2-3 times (32%), 4-6 times (19%), once (17%), 6+ times (16%).
18% of emails are sent on Thursdays, 17% on Tuesdays, 16% on Wednesdays.
The worst open and click-through rates are on weekends.
The time of the highest email open rate is 4AM, while 6PM shows the highest CTR.
50% of marketers claim that there is no perfect time for sending email campaigns as every person and business is unique.
The best day for emails is Thursday.
Email sending automation
If you didn’t use automation in 2023, do yourself a favor and listen to these email marketing automation statistics in 2024. Why? Because it will save you time, money, and, once again, convert more.
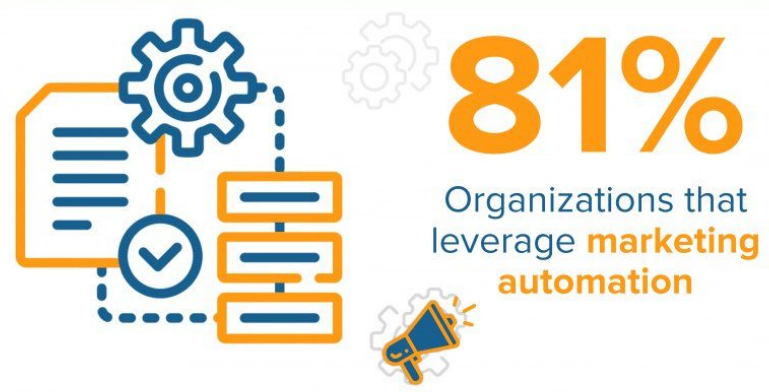
On average, 81% of companies use marketing automation.
The biggest marketing automation benefits are:
– saving time (30%)
– lead generation (22%)
– higher revenue (17%)
– customer retention (11%)
– monitoring marketing campaigns (8%)
– shortening the sales cycle (2%)
Marketing automation software users can benefit from a 451% increase in qualified leads.
35% of marketers use marketing automation software for content creation and email outreach services.
47% of marketers are sure that automation is worth the price.
67% of marketers use automation for drip or nurture campaigns;
56% of marketers use automation for segmentation purposes;
45% of marketers use automation for A/B testing.
68.5% of responders believe that automation improved the targeting of messages.
82% of marketers use automation to create triggered emails which result in 8 times more opens and greater earnings than typical bulk emails.
The best tactics for automation are mapping the customer experience (53%) and the use of personalized messages (51%).
Automation tools are used for sending all types of emails:
– welcome emails (47%)
– promotional sales emails (46%)
– transactional emails (28%)
– invitations and reminders (27%)
– blog updates (26%)
– upselling emails (23%)
– event-triggered emails based on customer lifecycle (15%), etc.
Average open rate of triggered email campaigns is 35.64%, CTR – 2.02%, and click-to-open rate – 9.94%.
The average unsubscribe and spam rates of triggered emails are 0.30% and 0.02% respectively.

Segmentation and personalization
Nothing can improve your emailing stats quite like personalization. Always segment your lists and personalize your emails – always make your client feel special.
Email list segmentation and personalization were the most effective email strategies in 2017.
Segmented email campaigns show 50% higher CTR than untargeted campaigns.
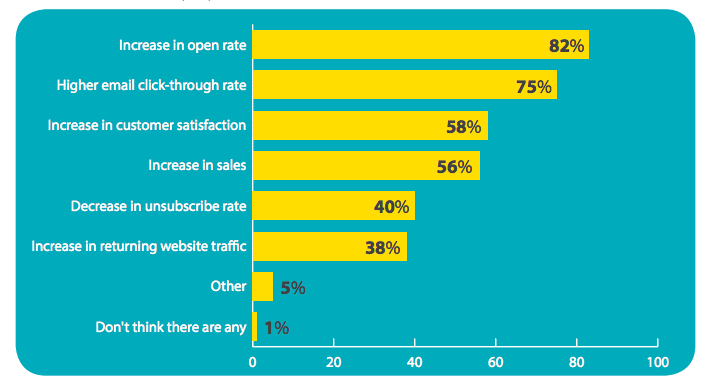
The top 3 reasons for using personalization in email marketing are improved open rate (82%), higher CTR (75%), and better customer satisfaction (58%).
Top 3 email marketing tactics are: list segmentation (51%), personalization (50%), and triggered emails (45%).
During a SuperOffice email marketing experiment, a segmented email campaign earned a 94% open rate and a 38% CTR, versus 42% open rate and 4.5% CTR in a non-segmented email campaign.
Marketers who send segmented campaigns notice a 760% increase in revenue.
88% of users agree they are more likely to respond to an email favorably if it looks like it’s been specifically created for them.
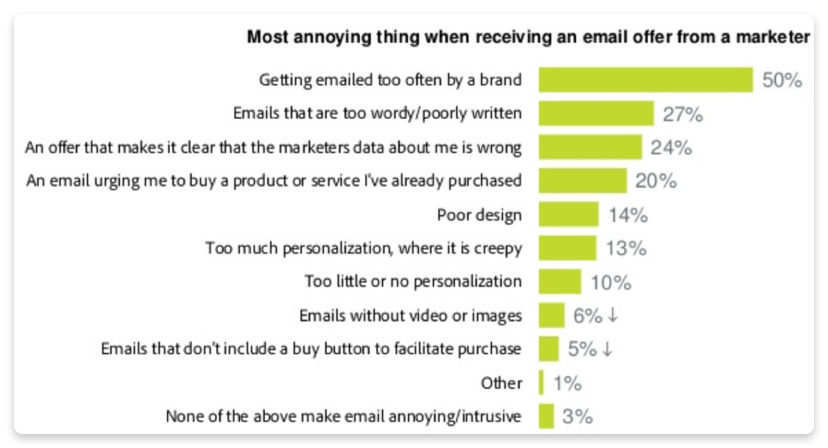
10% of respondents are annoyed by too little or no personalization.
According to the respondents, the most frustrating things about personalization are: recommending items that don’t match their interests (34%), expired offers (24%), name misspelling (15%), inappropriate season or location offer (14%), already purchased promotions (13%).
Only 4% of marketers use highly-personalized targeting, 13% use segmentation for different audiences, 31% claim that they use basic segmentation (2-5 criteria), and 53% do not target at all.
58% of revenue is generated thanks to segmented and personalized emails.
62% of marketers say that personalization is the most effective technique.
Today, 45% of marketers use trigger-based emails. However, they can be responsible for as much as 20% of your email marketing revenue.
Subject line, email body, and sign-offs
Writing a perfect email, subject line, and sign-off will define whether the recipient converts. Use these critical email statistics to find your perfect formula.
47% of people open emails based on the subject line, and 69% of customers can report emails as spam based on the subject line only.
Open rate by the number of words in the subject line:
– 6-10 words (21%),
– 0-5 words (16%)
– 11-15 words (14%)
– 16-20 words (12%)
Emails with “fw:” in the subject line are 17% less likely to be opened.
Emails containing personalization in the subject line are 22% more likely to be opened.
The email subject line most often contains:
– the customer’s name (46.21%)
– the product name/details (44.01%)
– the company name (42.88%).
At the same time, these three variables in the email subject line show the highest email marketing conversion rate (3.71%, 3.18%, and 3.58%, respectively).
Emails with active discount codes have an 8 times higher chance of making a sale than those without discounts.
An average marketing email consists of 434.48 words and takes 3.3 minutes to read.
Most (19% of subscribers) respond to messages of 200-250 words, 17% to those under 50 words, 13% – to 100-150 words long emails.
iPhone cuts off the subject lines over 32 characters.
52% of managers add signatures to their emails.
Emails with signatures with a photo receive 32% more replies than emails without it.
7 lines are the perfect size for an email signature (75% of senders include contact info, 60% add a phone number, less attach Twitter (7%), Facebook (3%), or LinkedIn (2%).
17% of adults use a formal style for email communication, 33% prefer an informal style, and 49% say it depends.
The most popular sign-offs are:
– Thanks (62%),
– name or initials (46%)
– Sincerely (44%)
– Love (28%)
– Regards (22%)
*respondents were allowed to choose multiple answers.
“Thanks” is the least annoying sign-off (only 3% dislike it), while 21% dislike “Peace”.
Visual content in email campaigns
Emails don’t have to be text only. Spice up your campaign by using additional visual content. After all, 45% of recipients say that they “like brands that do not take themselves too seriously”, so don’t be afraid to break out of the old standards. Check out these email marketing statistics and consider using emojis, videos, and pics in your next email campaign.
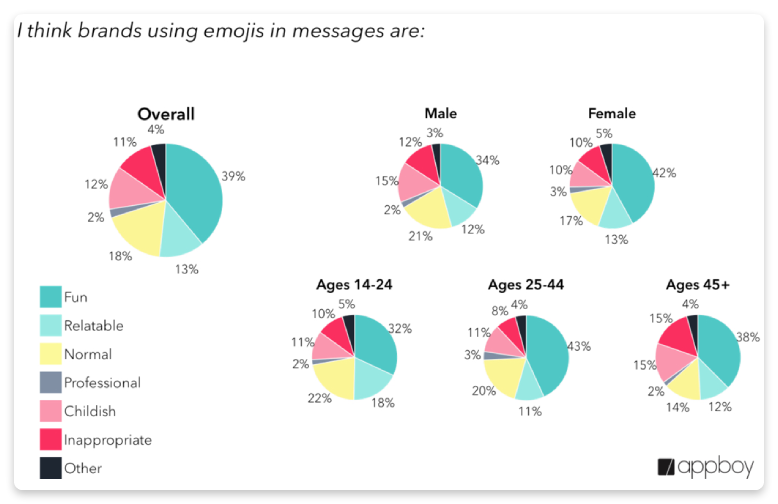
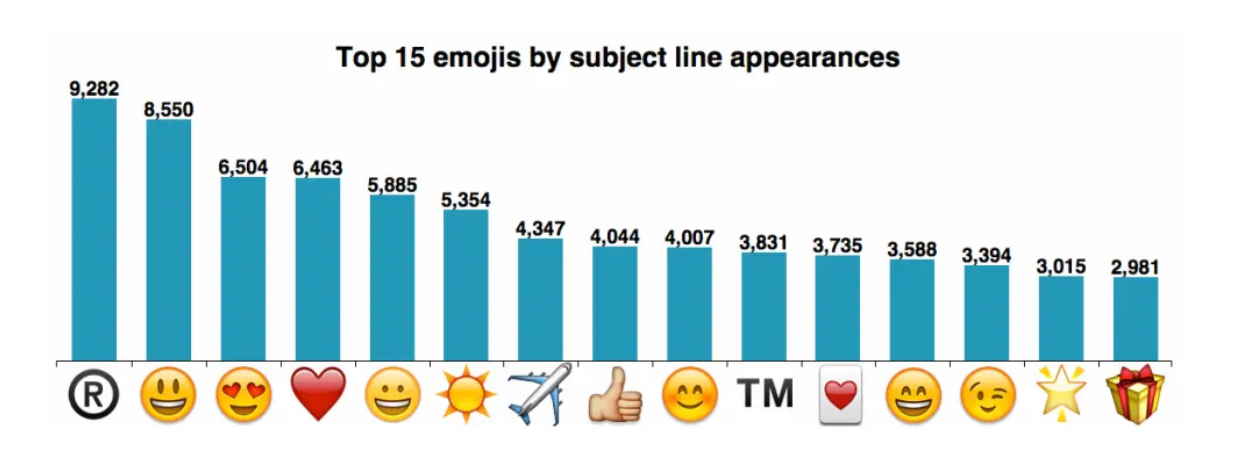
Emojis
Emojis in email is one of the most dividing things among email marketers. Some say that emails with emojis are more effective, while others claim that email statistics prove the opposite. However, it’s not all that simple.
68% of millennials use and like seeing emojis, GIFs and stickers in their emails; only 37% of respondents over 65 agreed with this.
Emails with an emoji in the subject line show a 56% higher open rate.
Women react to emojis more positively than men.
76% of those surveyed have at least once added emojis in their business emails.
Using appropriate emojis in holiday campaigns can reduce the complaint rate to 0%.
Videos
What happens when you embed video in an email? This collection of email marketing statistics will show you exactly what and prove that videos can be just the move for your next email marketing campaign.
An initial email with a video receives a CTR increase of 96%.
81% of marketers use video as a marketing tool.
78% of marketers using video say that it increases ROI.
Attaching a video in an email can lead to a 200-300% increase in CTR.
Using the word “video” increases open rates by 19%, CTR by 65%, and cuts the number of unsubscribes by 26%.
54% of email subscribers prefer emails with videos.
People mostly watch videos on a desktop (84%) while only 14% watch it on mobile devices.
90% of users say that videos help them make a purchase decision.
Source: HubSpot
Pics
Email content matters. But the email’s appearance can sometimes matter even more. The email marketing stats below show that pictures are as relevant for email marketing in 2024 as before.
Two-thirds of surveyed people claim that they prefer emails consisting mostly of images.
Emails that include some sort of graphics have a higher open rate (27%) and CTR (4.5%) than that of text-based emails (20% and 3%).
74% of users delete the message if it doesn’t open within 5 seconds (which is most likely to happen because of the size of the pictures in the email).
43% of recipients read the emails without turning the images on.
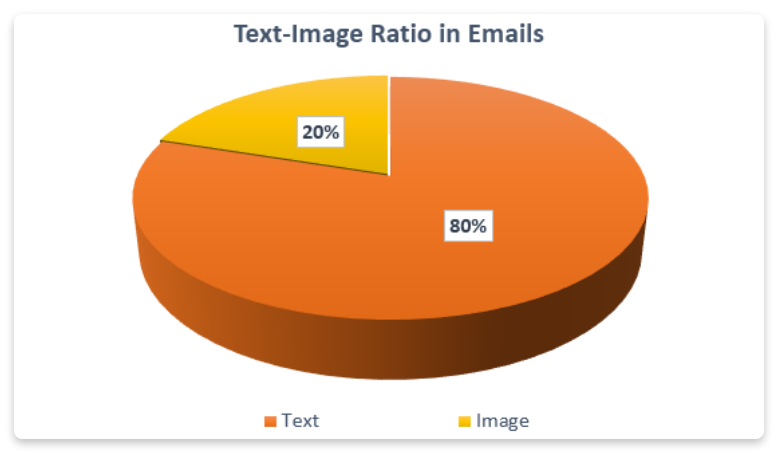
Research shows that it’s best to keep the text to image ratio in emails at 4:1.
Source: Pinpointe
Desktop and mobile optimization
Many marketers still underestimate the importance of mobile optimization. These email marketing stats confirm that mobile optimization is vital to the success of your email marketing campaign.
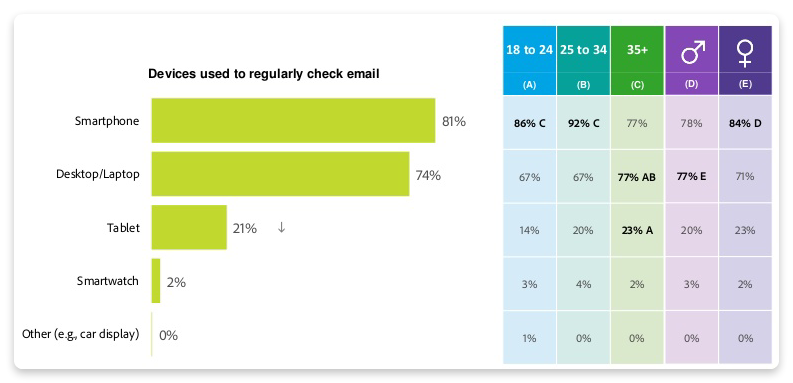
81% check their email on smartphones, 74% on desktop/laptop, 21% on tablet, 2% on a smartwatch.
88% of smartphones users check their Inbox on their phones.
Nearly 1 in 5 email campaigns wasn’t optimized for mobile devices.
42.3% of email recipients delete messages if they are not optimized for mobiles, 32.2% read the email later on desktop.
In 70% of cases, if the message doesn’t display correctly, it’s likely to be deleted within 3 seconds.
52% of B2C brands’ emails and websites aren’t both mobile-friendly.
57% of users say they won’t recommend a poorly designed mobile site.
In June 2018, 46% of emails were opened on smartphones, while desktop was used only by 18%.
88% of smartphone users regularly check emails on their mobile devices.
⅓ of professionals use their mobile devices to check their emails.
The two most popular email clients are Apple iPhone and Gmail (34% and 26% of opens respectively).
75% of Gmail users are using their mobile devices to access their email.
A mobile offer is 10 times more likely to be used than the same one in print form.
Source: Adobe
Good luck.
Wrapping up
Were our email marketing stats fascinating? Hope so.
Were the numbers useful? Definitely.
Will they be helpful in 2024? Absolutely.
Now it’s time to use these statistics to boost your lead gen efforts. Email tracking, email scheduling, automated follow-ups, segmentation, personalization, and pre-made templates — you can enjoy all of this with our Email Drip Campaigns tool.
Sign up for Snov.io free account to get access to dozens of email templates complete with personalization variables written by our best copywriters and curated by our sales.

Good luck and happy sending!


Wonderful post! Thank you for sharing such valuable data about email marketing. I’ve got lots of new information. In particular, I didn’t know that videos in emails are so profitable.
That’s amazing, Rachel! I’m really glad you’ve found my article useful.
Look through our guide to learn how you can boost your marketing results with videos in emails.
“An initial email with a video receives a CTR increase of 96%” wow, legit did not expect that number to be this high.
Striking, I know! So why don’t you try using videos in your campaigns, Des?
Look through our guide on using videos in emails, implement these ideas, and let us know how your email marketing metrics improve!
Great compilation. Any plans for an updated list in 2020?
Thanx, Bernie. And yes, surely, we will update this article. Stay tuned!
Wow, a lot of great and interesting stats.
I’m planning on increasing video marketing and production this year. It’s time consuming but worth it.
Agree! Will you be using it in email campaigns, for onboarding, or for YouTube marketing?
Nice article!
Great information for a new online entrepreneur. The e-mail marketing is a very crucial part of any online business and your post has validated it with the right examples and numbers.
Thanks for sharing
Thanks! We are glad to be helpful!
If you know who your target audiences are, and how to reach them then email marketing is the most suitable and powerful marketing tool for you!