

In this guide, you’ll learn about the metrics collected when you send email campaigns, and how to monitor them.
Snov.io allows you to track all the key engagement metrics in your campaigns.
It gives you the ability to monitor and analyze the success of your campaigns and identify areas for improvement.
# Engagement chart per time period
# Engagement rate per time period
How to enable tracking in campaigns
In a campaign builder, enable the Tracking options on the 3rd step to track engagement metrics.
Learn more about how open tracking works –>
Read about link tracking and how to use it safely –>
![]()

Learn more about getting campaign engagement notifications here –>
After sending your email campaign, the Email drip campaigns page will display the stats of the sent campaigns along with their current status.
On the campaigns preview page, you will find the total number of emails sent, opened, clicked, and replied to in this campaign.
For a more detailed report on a specific campaign, click on its name to access the campaign Statistics dashboard.
What metrics are tracked in campaigns
# 1 General statistics
In the General statistics section, you’ll see the total campaign stats that represent delivery success rate. It is calculated in comparison to the total number of recipients in a campaign.
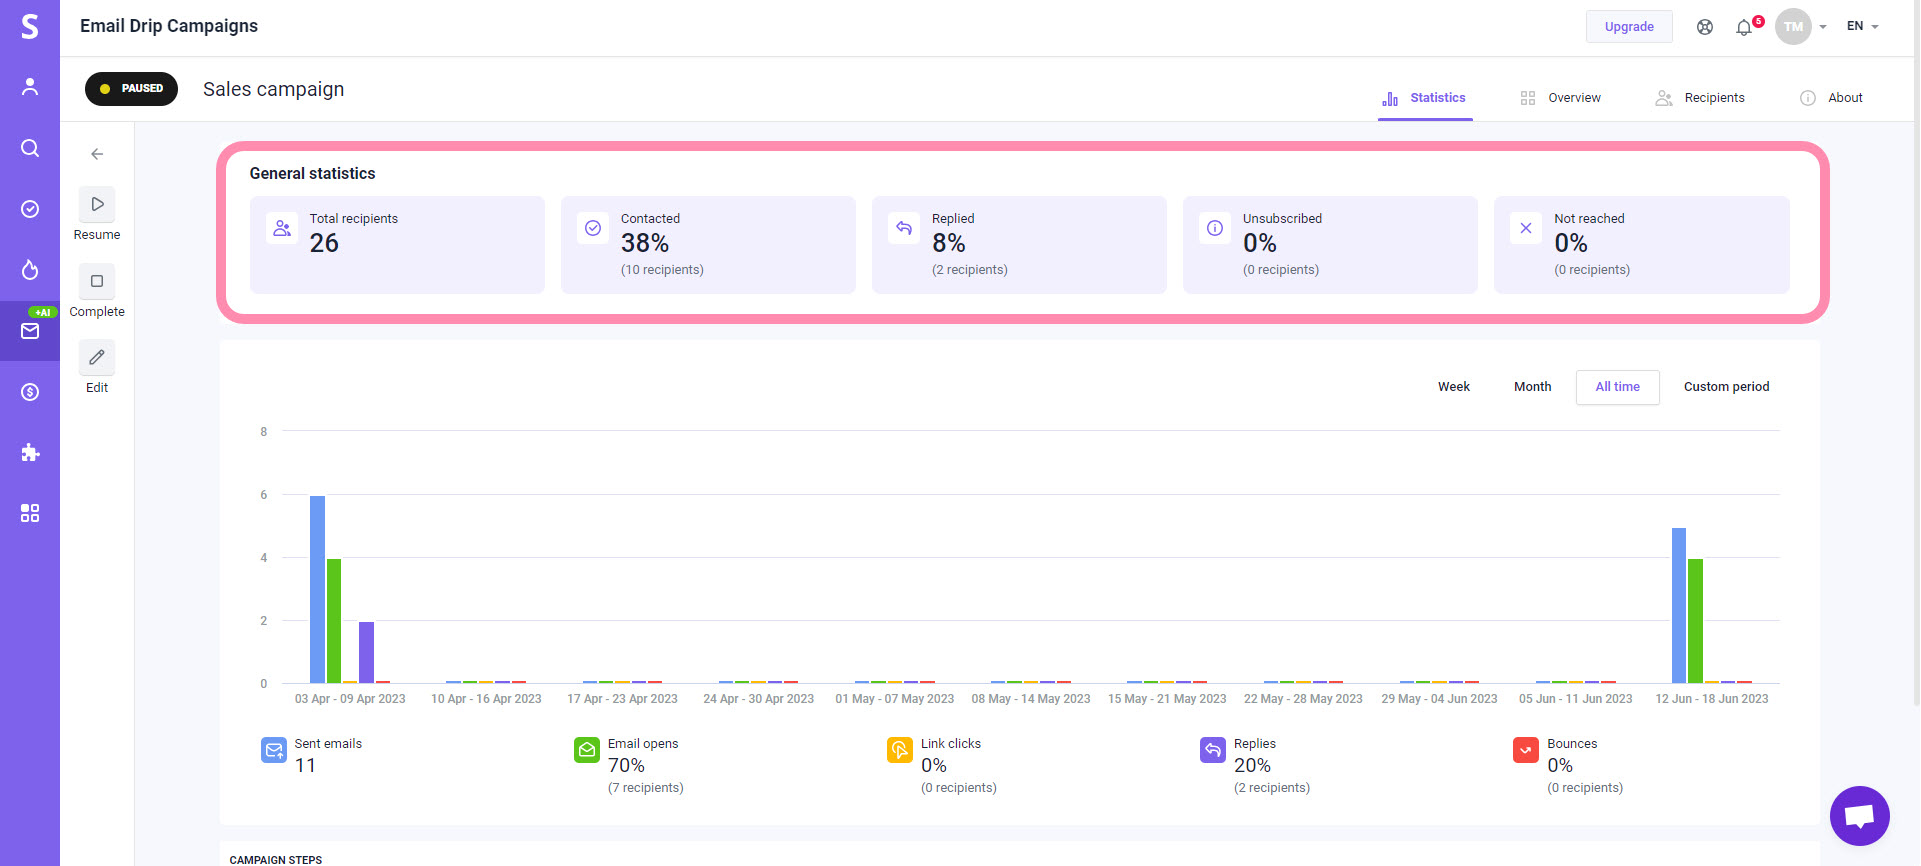

- Total recipients: This includes all the recipients who have been added to the campaign from your prospect list.
- Contacted: Shows how many recipients have received at least one email from this campaign.
- Replied: Shows the total reply rate for the campaign and how many recipients have replied.
- Unsubscribed: This includes recipients who have unsubscribed from the campaign after receiving an email.
- Not reached: The number of recipients that haven’t received the campaign due to email delivery errors or auto-responders.
# 2 Engagement chart per time period
The rate over time chart illustrates the periods when your campaign achieved the highest engagement.
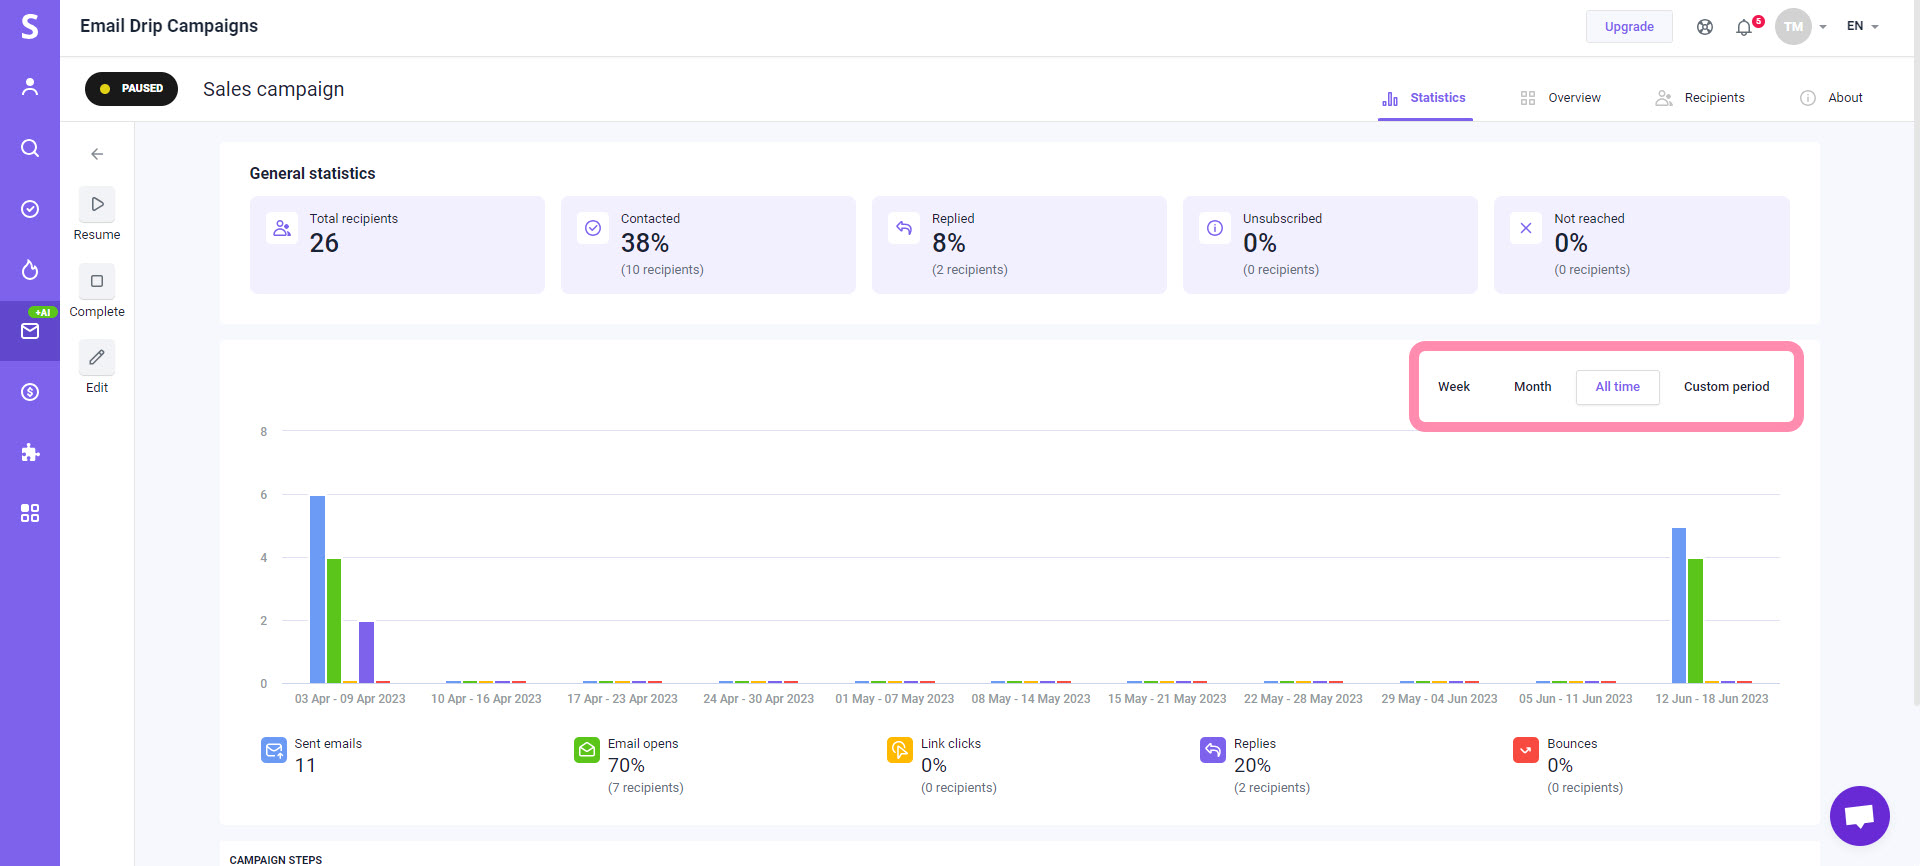
By analyzing this data, you can see the most effective periods of your campaign and identify factors (such as changes in schedule or content) that might have influenced the results.
Above the chart, you can choose the timeframe for displaying: Week, Month, All time, or Custom period. By default, it’s set to All time.
Depending on the selected period, the sections in the chart will represent a day in a week, a week in a month, or all weeks the campaign was active.
Hover over a section in the chart to view its statistics.
# 3 Engagement rate per time period
The metrics below the chart show engagement rate per selected time period. Engagement rate is calculated based on the total number of emails sent in a campaign.
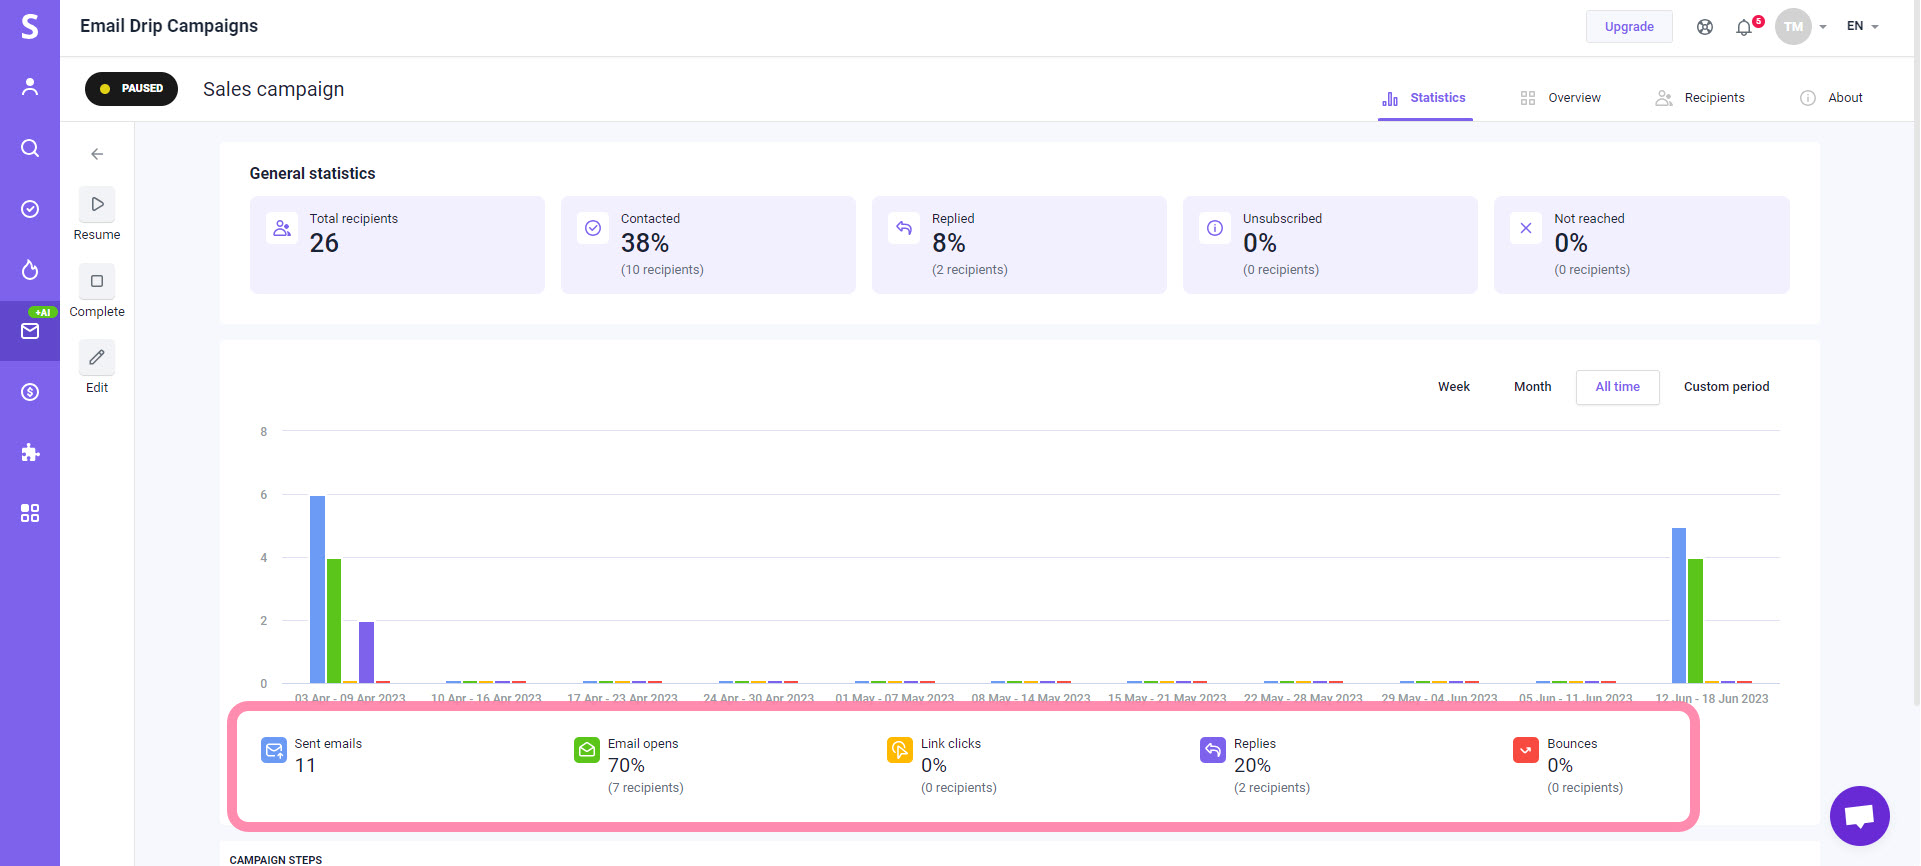
- Sent emails: The total number of emails sent in the chosen period.
- Email opens (requires open tracking to be enabled): Recipients that have opened at least one email sent in the chosen period.
- Link clicks (requires link tracking to be enabled): Recipients that have clicked at least one link in any email sent in the chosen period.
- Replies: Recipients that have replied to at least one email sent in the chosen period.
- Bounces: Recipients who have had all emails sent to them bounced back (due to email delivery error). If the email is successfully delivered after a retry, it is no longer included in the bounce rate.
# 4 Metrics per each email
The bottom section displays the total engagement rate for each step in the sequence (including A/B testing variants).
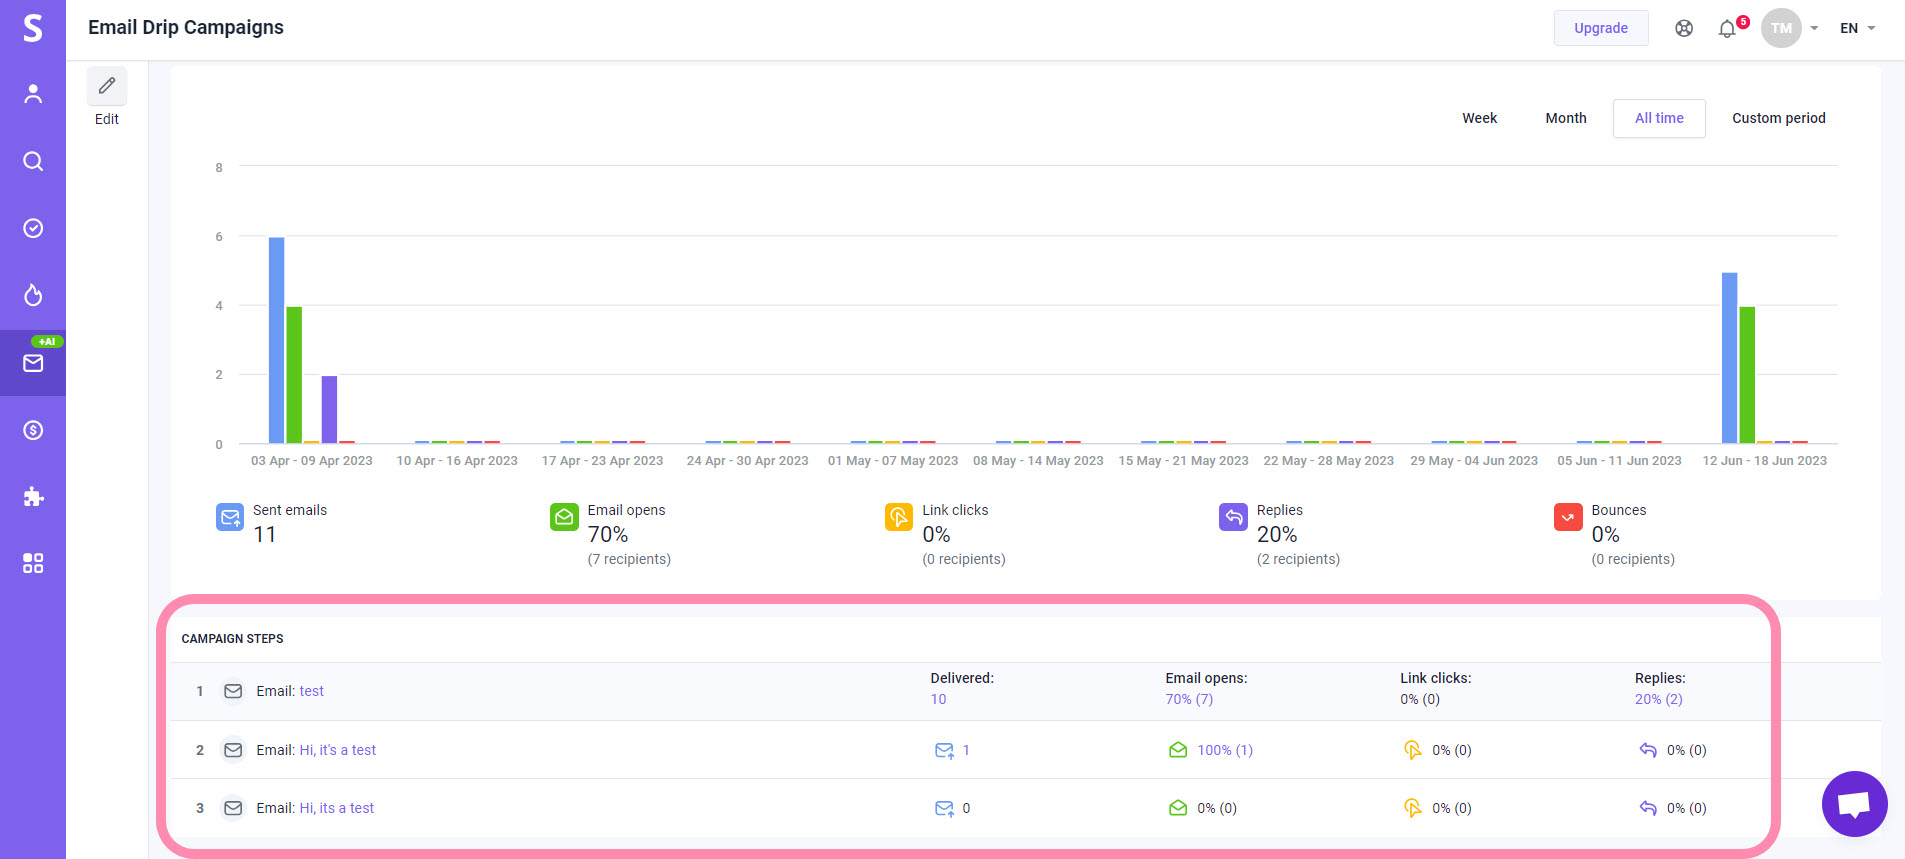
Click the subject line of the email to see the content preview. It allows you to analyze the effectiveness of specific emails and make improvements if necessary.
In the Recipients tab, you can manage recipients using different parameters, such as their status or activities.
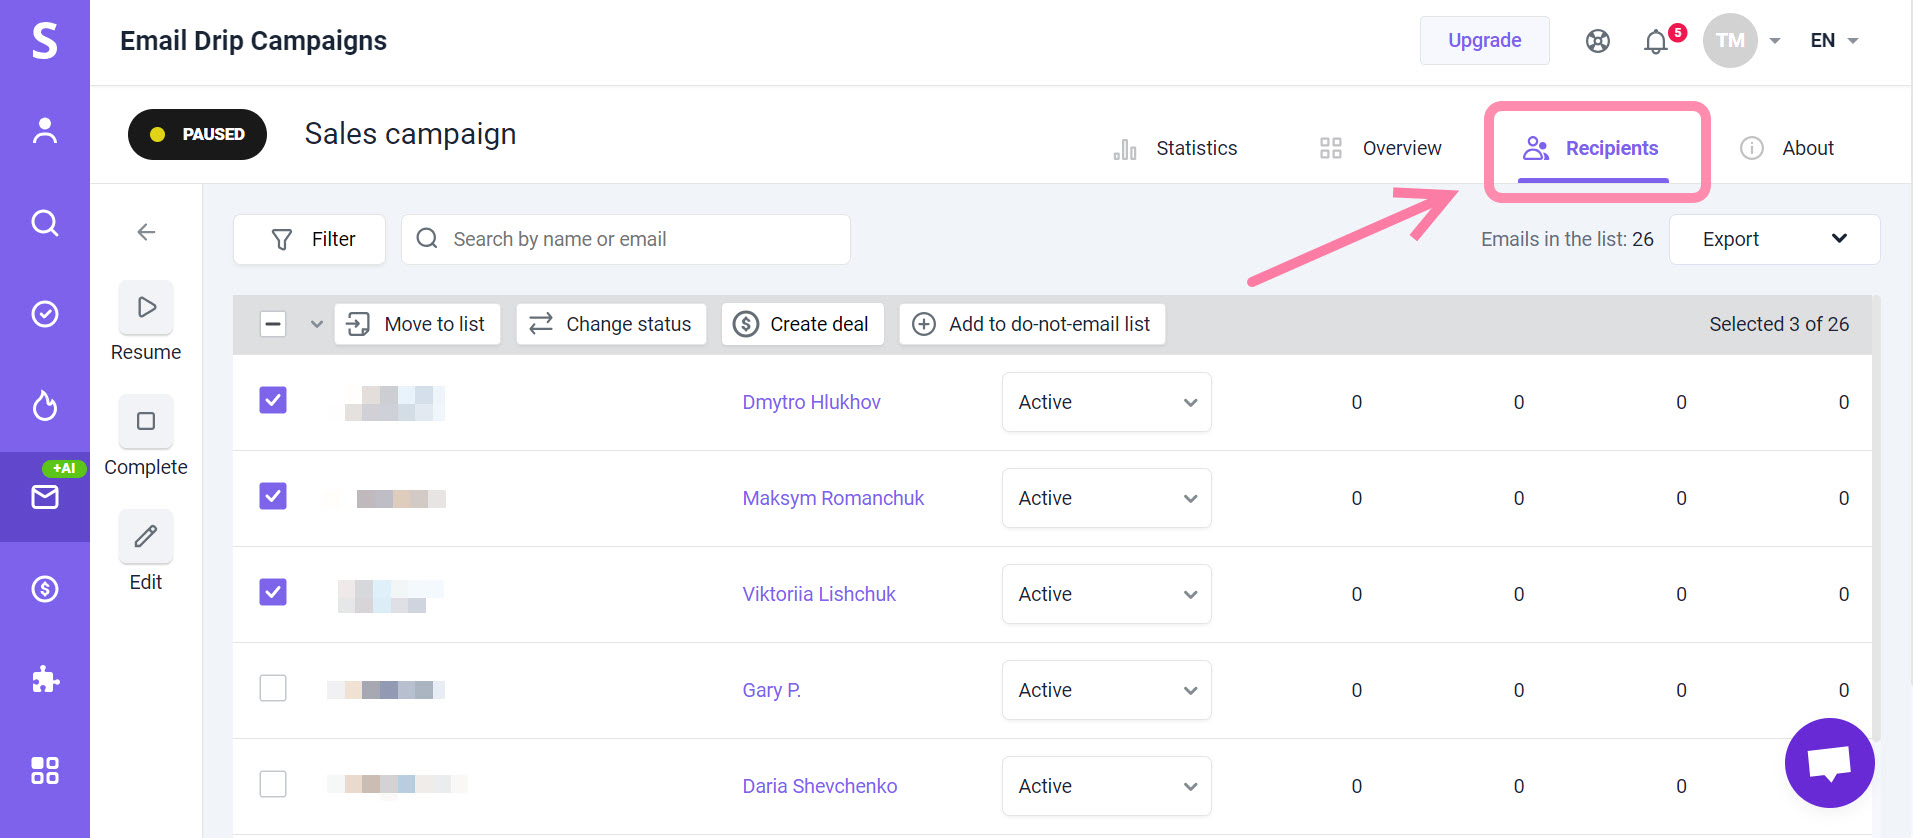

Learn more about working with Recipients tab –>
If you have a question that wasn’t answered here, don’t hesitate to contact our Customer Care team. You can reach us at help@snov.io or through live chat.