Annual sales report
Annual sales report, also known as yearly sales report, is an annual activity report made by a salesperson or their management. It presents the trends that took place in the business’ sales volume over a year and gives an overview of what goals need to be set for the upcoming year.
For example, a typical annual sales report might contain data on sales volume observed per item or group of items, how many new and current customers were contacted and when, and any costs involved in promoting and selling products. Yearly sales reports are generated using compilations of daily, weekly, and monthly reports.
Why do you need annual sales reports?
Sales reporting is more than just adding up revenue and the number of sales you made. What makes for effective sales management is knowing the sales process, as this forms a foundation for successful sales operations, strategy, and analysis.
The process of recording the information of every step of the sales process and analyzing the data helps predict where your company’s success is and how to improve its results. You need to see exactly what is driving the sales to figure out how to keep them up as your company grows.
What to report on
Sales metrics are the quantifiable indicators that show you whether you are achieving your targets and how different aspects of your sales operations are performing. They help you determine where your efficiencies and inefficiencies are.
Number of prospects
This is the total number of prospects you have in various stages of your sales funnel. While it’s important to know how many deals are in your pipeline, it’s also crucial to know what stage your prospects are in, when they are expected to close, and the likelihood of them converting into revenue sources.
Deal size
Sales contracts can have widely different values, depending on a number of factors. Still, it’s necessary to determine the average deal size in your sales funnel to make quick but accurate sales forecasts and strategies.
Conversion rates or close rates
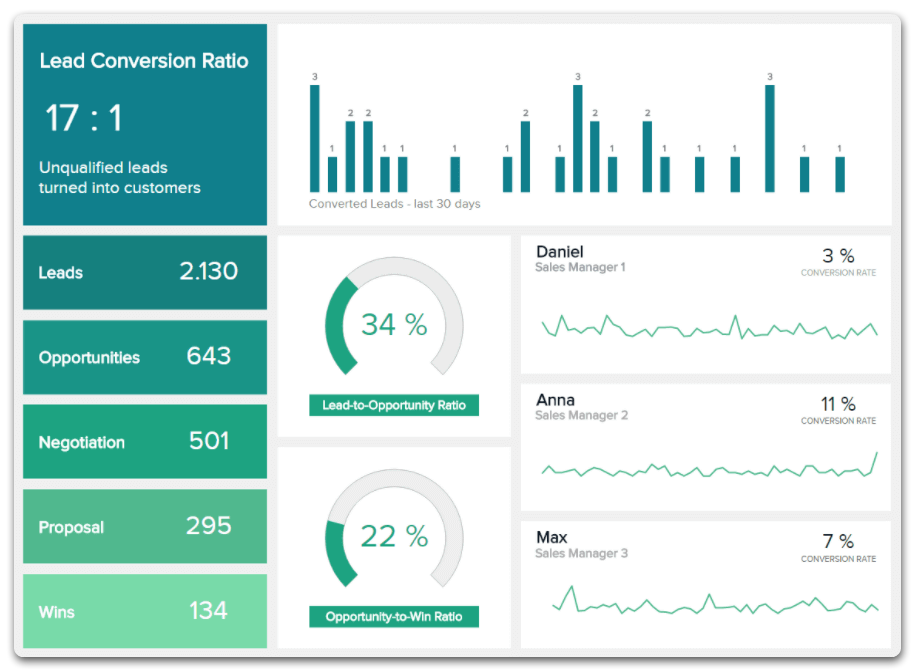
These metrics help you determine the average number of cold prospects you need in order to convert one prospect into a paying customer, based on past results. In other words, for every deal that you closed, how many open deals do you have?
Sales velocity or sales cycle time
It refers to the average time it takes for a lead to enter the sales funnel and go to the final stage of the sales process – purchase. The faster it takes them to complete the sales cycle, the better.

There are some other questions you can ask that are not technical but still important in understanding your sales and prospects:
- What is your ideal customer profile (ICP)?
- Where are your best leads coming from?
- What motivates prospects to convert into paying customers?
- What factors prevent prospects from making a purchase?
- Are there any bottlenecks in your sales funnel? If so, how can you improve them?
- Do individual reps meet their sales quotas?
- Is your sales team on track to meet specific goals?
- What are your top sales representatives doing, and how can the rest of the team replicate it?
- How do sales compare to previous periods?
- What is your forecast for the next period?
Such reports can also be done weekly, monthly, or quarterly to stay on track and test the waters if you are new at this, while the bigger analysis can be done at the end of the year. It may be tricky to figure them out when you are just starting out, but after you have tracked activities for a while, you should start seeing the value in your sales reports.
How to create a sales report
To easily create an annual sales report, you should keep daily, weekly, and monthly reports to compile. Using a CRM program or even just Excel, all information can be organized and made into graphs to see trends.
Daily sales report
To make a daily sales report, pick information that regards daily progress. For example, include lead data that came in that day. Gathering this data saves a lot of headaches later when putting together the yearly report. A few factors that you should consider reporting are:
- Talk time
- Calls made
- Emails sent
- Meetings booked
- Lead quality
Weekly sales report
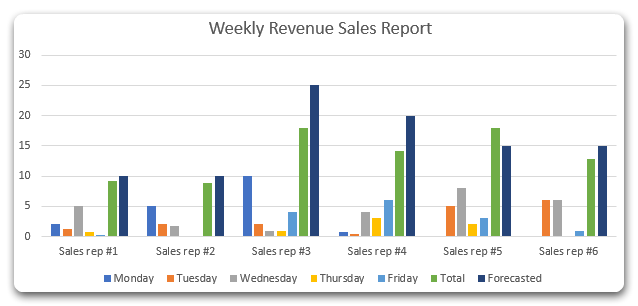
Weekly reports allow tracking and measuring your productivity week by week. By doing so, you can see trends over time without having to wait for monthly reports. Some of the factors to report include:
- Weekly revenue
- Number of new clients acquired
- Comparison of the current week numbers with the previous week numbers
- Where your clients are in the sales funnel

Monthly sales report
A monthly sales report enables you to get a broader perspective of sales performance and an insight into what to expect next month or for the rest of the quarter. Important factors to consider are:
- Number of conversions
- Number of deals closed
- How clients move through the sales funnel

With all the information you have been gathering, it’ll be easier for you to make your yearly sales report. By focusing on the measurable data that has clear conclusions, you can add value to each salesperson and the company, in general.
Wrapping it up
Sales reporting helps take the guesswork out of your business decisions by giving you an open understanding of where your company stands at every step of your sales process. Because of this, sales reports are crucial for companies of every size, even if the sales teams are small. Knowing where you have been shows you where you are going.


