Net asset value
If you struggle with data-driven decisions, you need to understand the basics of financial accounting and be aware of how to interpret financial KPIs.
Depending on an organization’s property type, business niche, and local legislation, an on-hand reporting shortlist must include distinct financial indicators. For joint-stock companies, one of the most representative is Net Asset Value, or NAV.
Before defining the term, let’s recall some basics of accounting.
Basic elements of financial statements
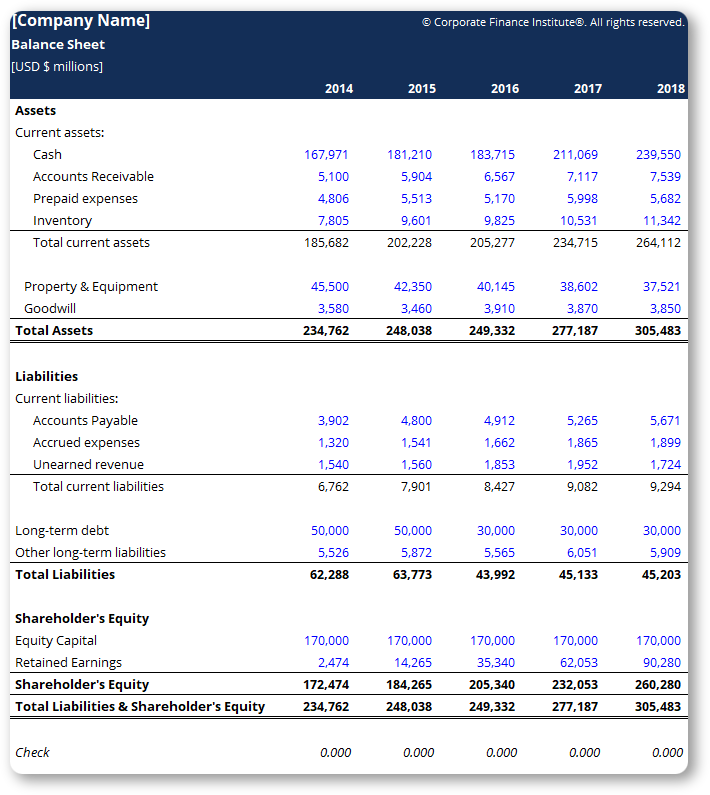
All company’s properties and operations are disclosed in the primary reporting document — a balance sheet. This is an obligatory recurrent bulletin for both commercial and non-profit organizations. The balance sheet structure is pre-determined by local legislation and international standards, like IFRS (International Financial Reporting Standards).
The IFRS determine 5 components of reporting framework:
- Assets
These are outcomes of the company’s operational efforts. Assets are necessary for revenue and profit generation in the future. Material objects, money in bank accounts, receivables, and goodwill are the most representative examples of assets. - Liabilities
These are obligations a company needs to pay or transfer to other entities or the government. External debt, including interest, bonds payable, and accounts payable are some of the liabilities businesses mention on the balance sheet. - Equity
This is what remains of an asset after all related liabilities are subtracted from it. For example, if you bought a car worth $50,000 with a loan amounting to $25,000 (sum + interest), the car’s equity value would be $25,000. Equity is not something that is calculated once and for all — it is assessed in momentum. - Income
The income statement reports a company’s financial performance over a specific accounting period with either a plus or minus sign. The latter is called losses. - Expenses
Expenses demonstrate decreases in assets and increases in liabilities that result in equity reduction.
An organization reports on these five components in its financial statements, which are obligatory disclosed once during the reporting period (one financial year, in most cases).
Now, imagine you have to assess a random company’s financial report and conclude its overall financial wellbeing. Not going too deep into the generally accepted metric names, what would you first pay attention to? Even an amateur in finances will say — assets must exceed liabilities. Otherwise, at some point, the company will inevitably face financial problems, including bankruptcy.

So what is a Net Asset Value?
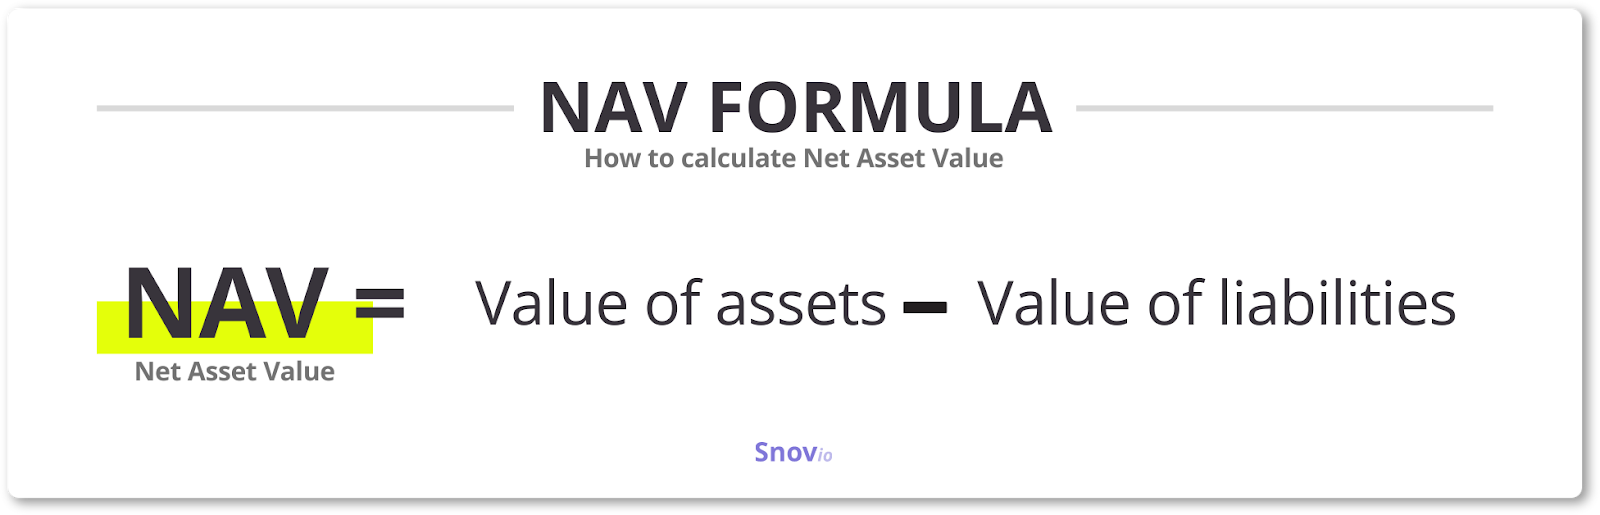
A Net Asset Value is one of the organization’s monetary stability indicators. It’s calculated as the total value of the company’s assets minus the total value of its liabilities.
Net Asset Value = Value of assets – Value of liabilities
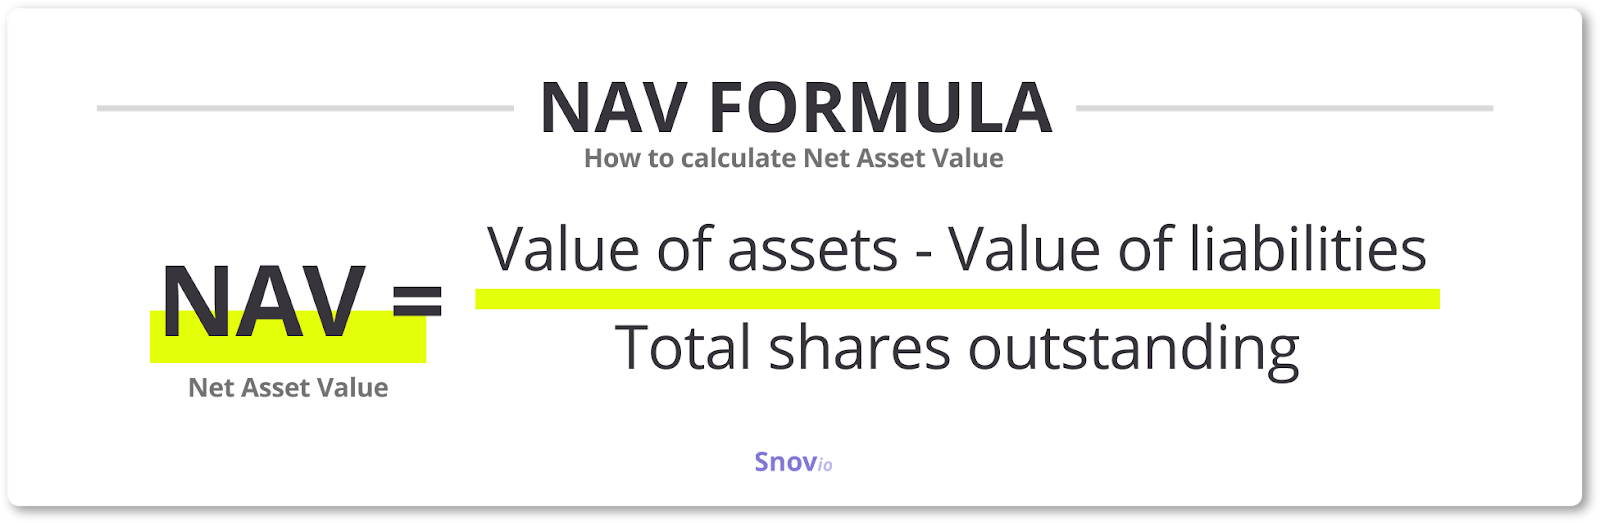
If it’s represented on a per-share basis, the difference is then divided by the number of shares held by investors.
Net Asset Value = (Value of assets – Value of liabilities) / Total shares outstanding
NAV is taken into account by both individual and institutional shareholders when determining whether a particular share’s market price is fair. For example, Organization X makes an IPO (initial public offering) with 1,000 shares to raise 200 thousand dollars. In this case, the proclaimed price per share is $2,000.
To determine if the organization’s shares were evaluated decently, you can analyze its financial statements and appraise the real share price. If it exceeds the proclaimed price, benefits will outweigh investing costs.
The Net Asset Value is a conventional valuation indicator. Conforming to the US SEC requirements, unit investment trusts and mutual funds are required to calculate it once an operational day or even more frequently.
How to calculate Net Asset Value?
Let’s use a per-share NAT formula that includes the total value of the company’s assets, the total value of its liabilities, and the number of shares held by investors.
To calculate the NAV value, you first need to:
- Calculate marketable securities and all other assets
To calculate securities, use their closing price at the end of a day — find it by checking quotes on stock exchanges on your own or use aggregating services, such as Exchange Data International. Other value terms are cash and its equivalents, as well as account receivables.
- Calculate liabilities and expenses
A comprehensive calculation should be based on both long-term and current liabilities. The latter are ones to be paid within one year — short-term loans, lines of credit, deferred revenue, and wages.
- Consider the number of a company’s outstanding shares
These are stocks held by both external and internal investors. You can find their value on the balance sheet — under the heading “Capital Stock.” Besides NAV, this value is also used to calculate other success benchmarks, such as EPS (earnings per share) and CFPS (cash flow per share).
To better understand the Net Asset Value formula, consider this calculation example.
The ABC Inc. mutual fund has reported the following values in the Q1 financial statements:
- Assets:
- Marketable securities: $3,300,000
- Bank accounts: $1,700,000
- Accounts receivables: $500,000
- Accrued income: $900,000
- Liabilities:
- Trade accounts payable: $500,000
- Short-term debt: $400,000
- Debentures: $1,000,000
- Deferred tax liabilities: $300,000
- Shares:
- Q shares outstanding: 2,000,000
Based on the following information, ABC Inc.’s Net Asset Value is:
($3,300,000+$1,700,000+$500,000+$900,000)-($500,000+$400,000+$1,000,000+$300,000) * 2,000,000 = $2.1 per share
The metric is usually calculated on any other business day. This way, it can be used to track a single organization’s performance over different periods. Venture investors, for example, choose to disclose NAV as often as once a day. Twenty-four-hour fluctuations, however, are not quite representative for major companies — they are used to assess mutual funds only.
Bottom line
NAV metric shouldn’t be used alone, though. Before making any judgments regarding an organization’s financial stability or putting money in its shares, assess its performance history and compare it with market benchmarks, like Dow Jones or S&P 500 indexes.


