This article explains how to export reports from the Reports dashboard. You can download CSV reports with prospect activity data or export a visual PNG report with campaign analytics.
Data export is available with premium plans. Upgrade your plan in account settings to get access.
While reviewing analytics on the Reports dashboard, use export options to download recipient lists based on filters and KPIs, or save a visual snapshot of your report.
Export a visual PNG report
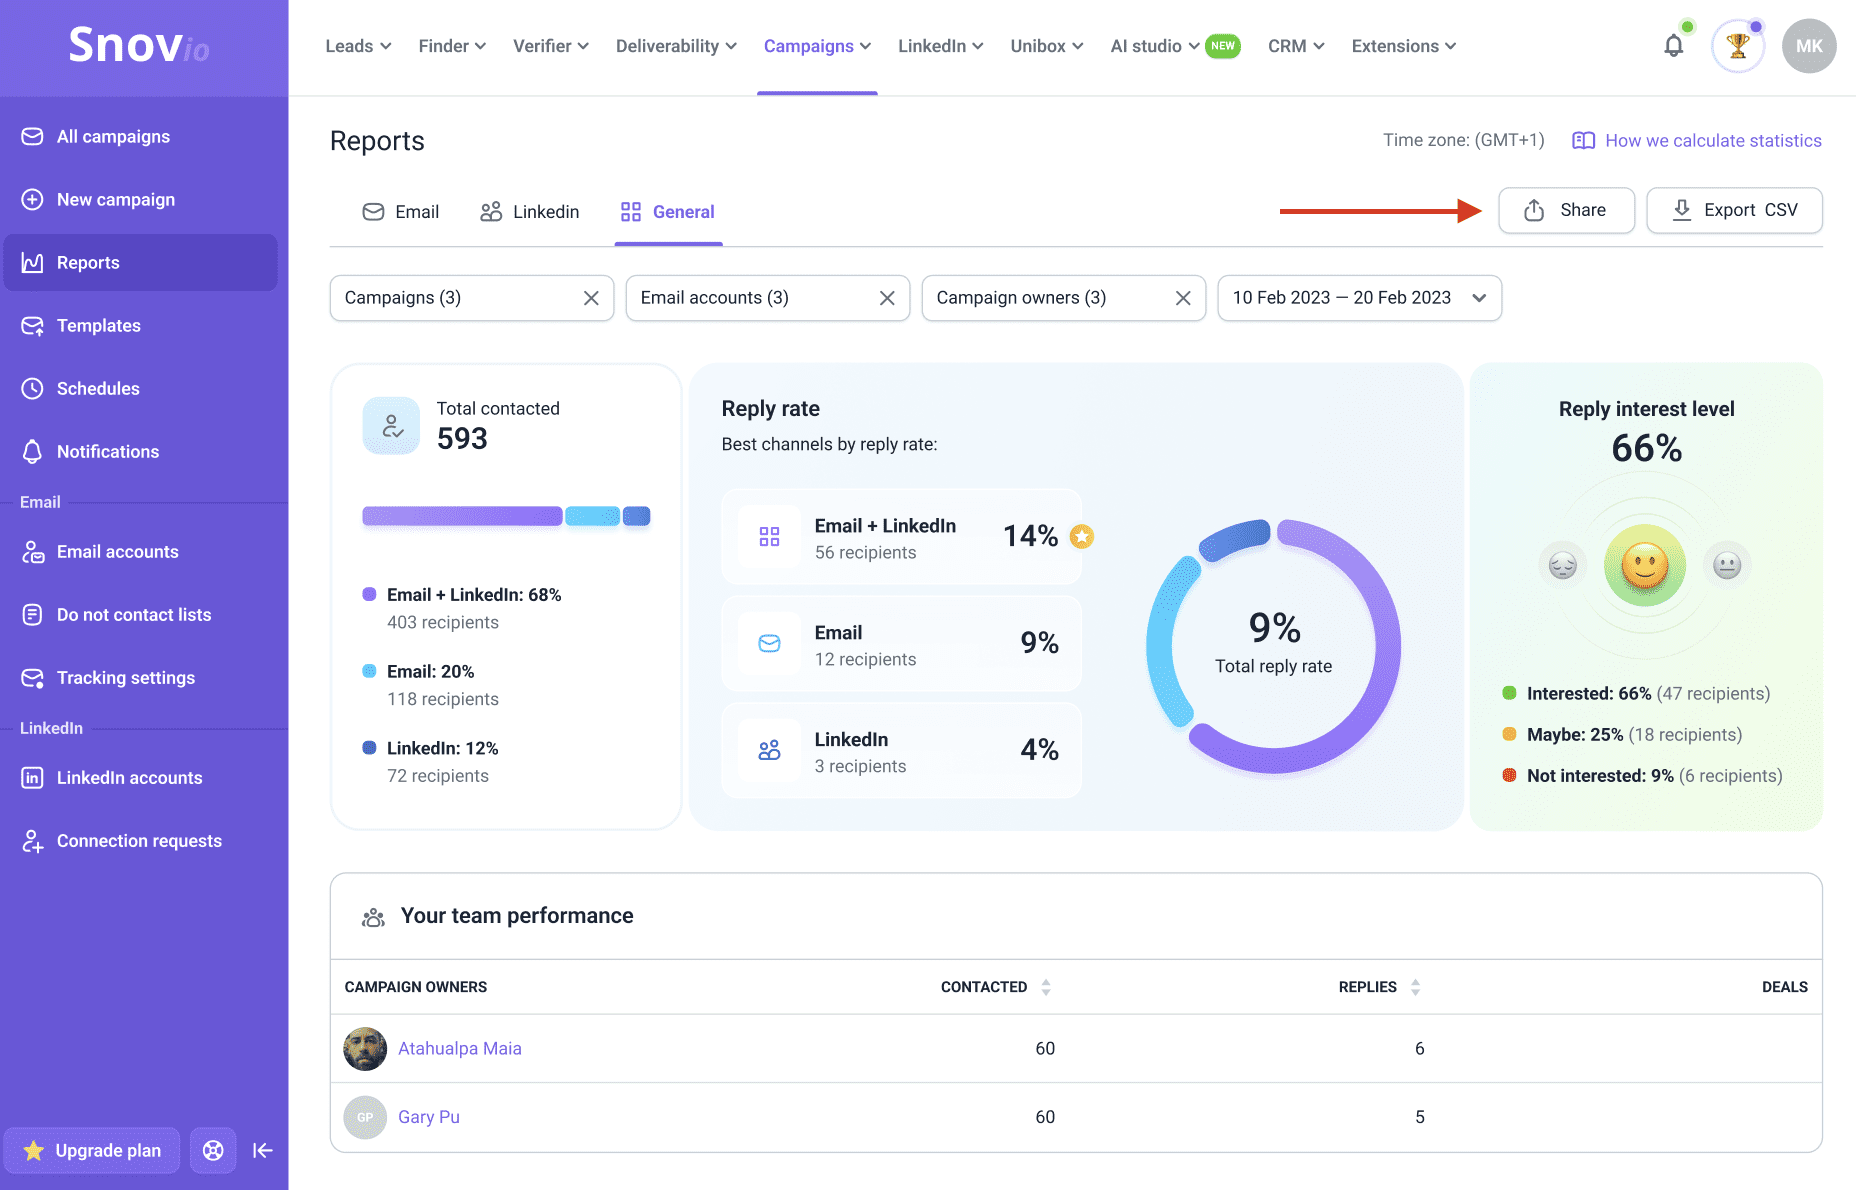
You can export a visual report from the Reports dashboard to present campaign performance to clients, share results with your team, or include outreach analytics in internal reports.
The PNG report includes the analytics currently shown on the dashboard based on the selected report type, filters, and time period. It can include overall metrics, channel performance, reply interest level, activity charts, and team performance data.
To export a report as a PNG, go to Reports. Choose the report type: Email, LinkedIn, or General. Apply the filters you need, then click Share in the top-right corner.
The PNG report reflects the data currently shown on the dashboard. Before exporting, check the selected campaigns, accounts, campaign owners, and time period.
Export a default CSV report
To download a report with overall data for all recipients, click Export CSV on the right. This option is available in all report types:
- Email: The default Email export includes data for recipients you’ve sent at least one email within the selected time period
- LinkedIn: The LinkedIn export includes data for recipients to whom you’ve sent a connection request, message, or InMail within the selected time period
- General: The General export includes data for recipients you've contacted via email or LinkedIn: a connection request, message, or InMail
The Export CSV option has a limit of 200,000 rows per file. If your data exceeds this limit, use filters to break down the export into smaller parts.
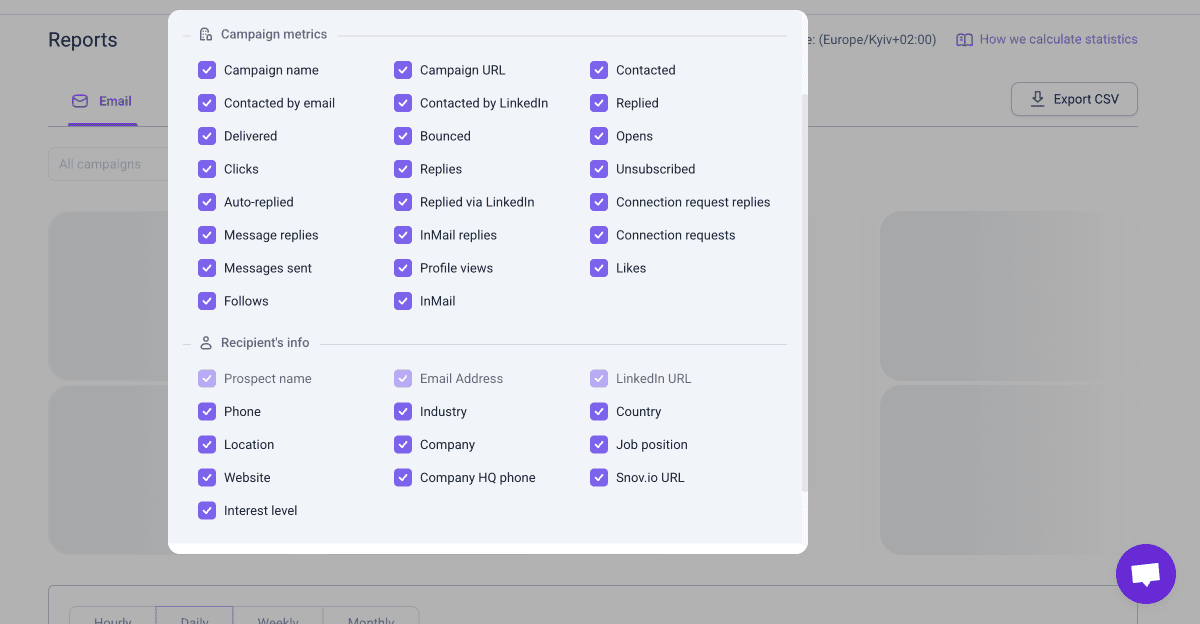
The general campaign report includes every prospect added to your campaigns. For each prospect, it shows performance analytics for both email and LinkedIn, along with the prospect’s profile details.
Below is the list of campaign and prospect fields included in the report.
Campaign metric fields
- Campaign name
- Campaign URL
- Contacted
- Contacted by email
- Contacted by LinkedIn
- Delivered
- Bounced
- Opens
- Clicks
- Replies
- Replied
- Auto-replied
- Replied via LinkedIn
- Message replies
- InMail replies
- Messages sent
- Profile views
- InMails
- Endorsements
- Unsubscribed
- Connection request replies
- Connection requests
- Likes
- Follows
Recipient info fields
- Prospect name
- Email Address
- LinkedIn URL
- Phone
- Industry
- Country
- Location
- Company
- Job position
- Website
- Company HQ phone
- Snov.io URL
- Interest level
Create a custom CSV report with filters
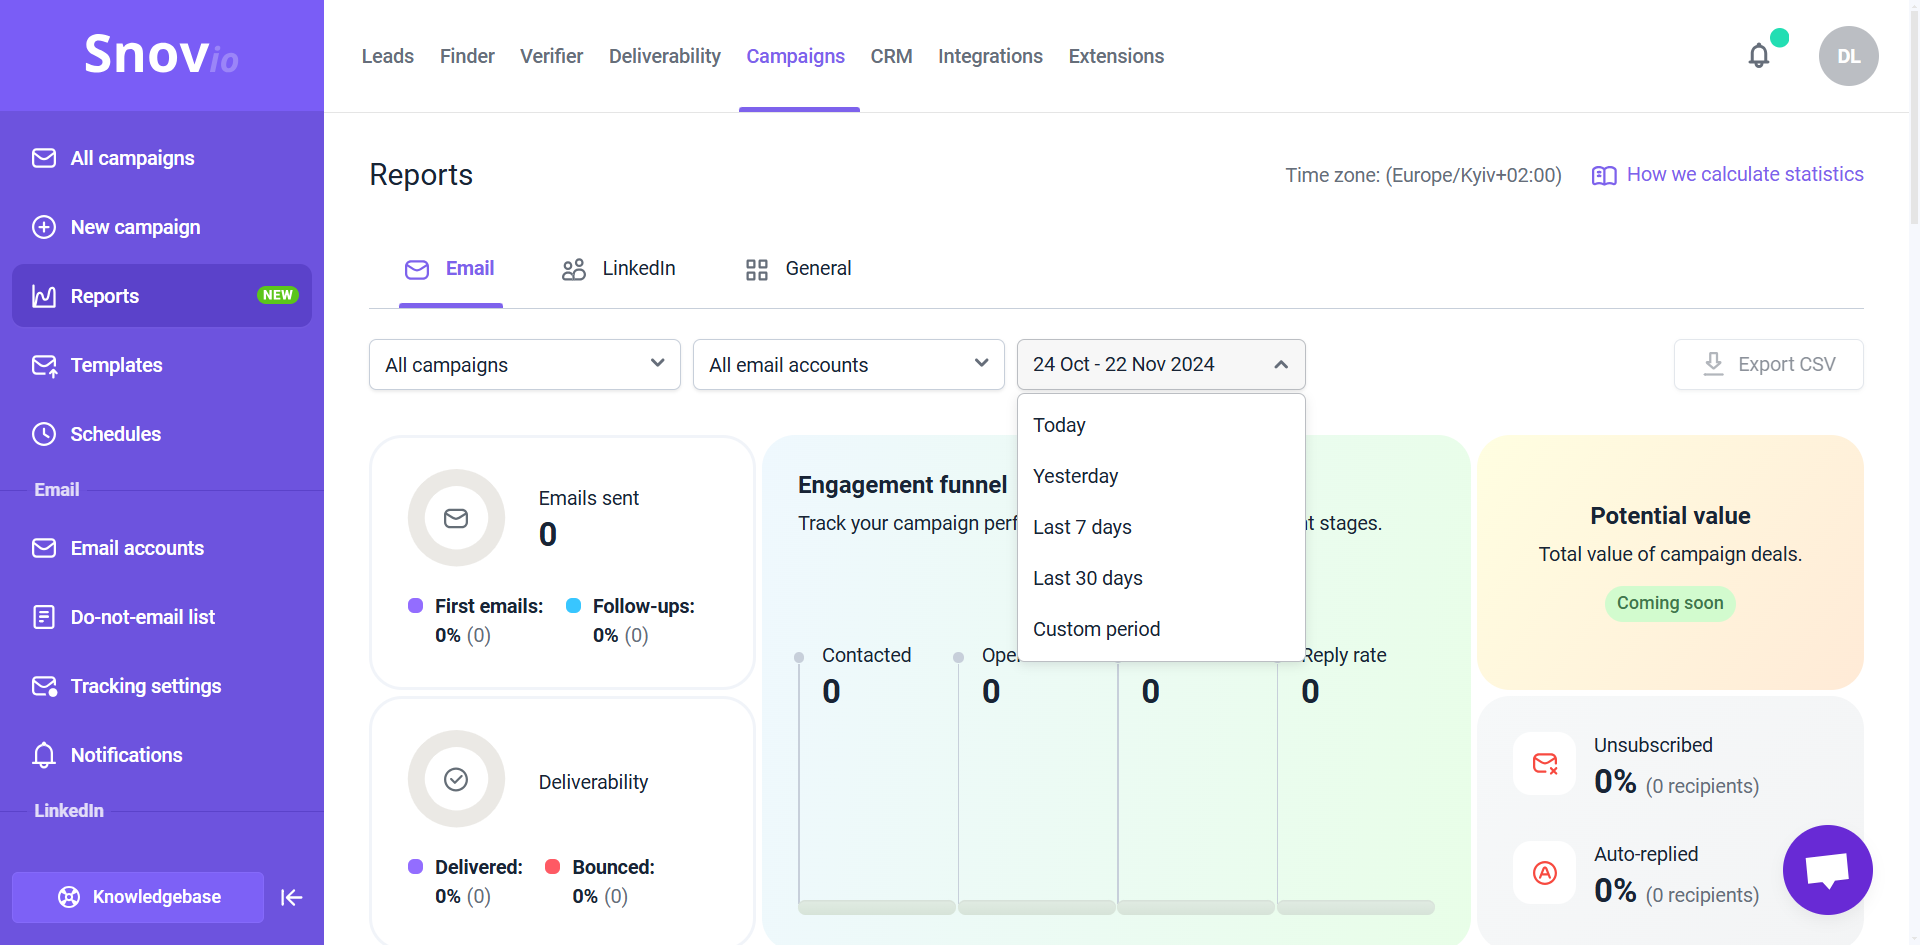
By default, the export will include data for all campaigns over the past 30 days. To create a custom report, adjust the filters at the top.
This will filter the recipient data in the report based on your selected filters: campaigns, sender accounts, team members, or time period. After adding the necessary filters, click Export CSV in the top-right corner to download the report.
Export recipient data by KPIs
You can view and download recipient data for the main metrics in each type of report: Email, LinkedIn, or General. The metrics available for export are highlighted in blue when you hover over them.
Remember to check the filters before exporting lists by KPIs. The data included in the report updates based on the filters you apply.
The KPIs for export in the Email report
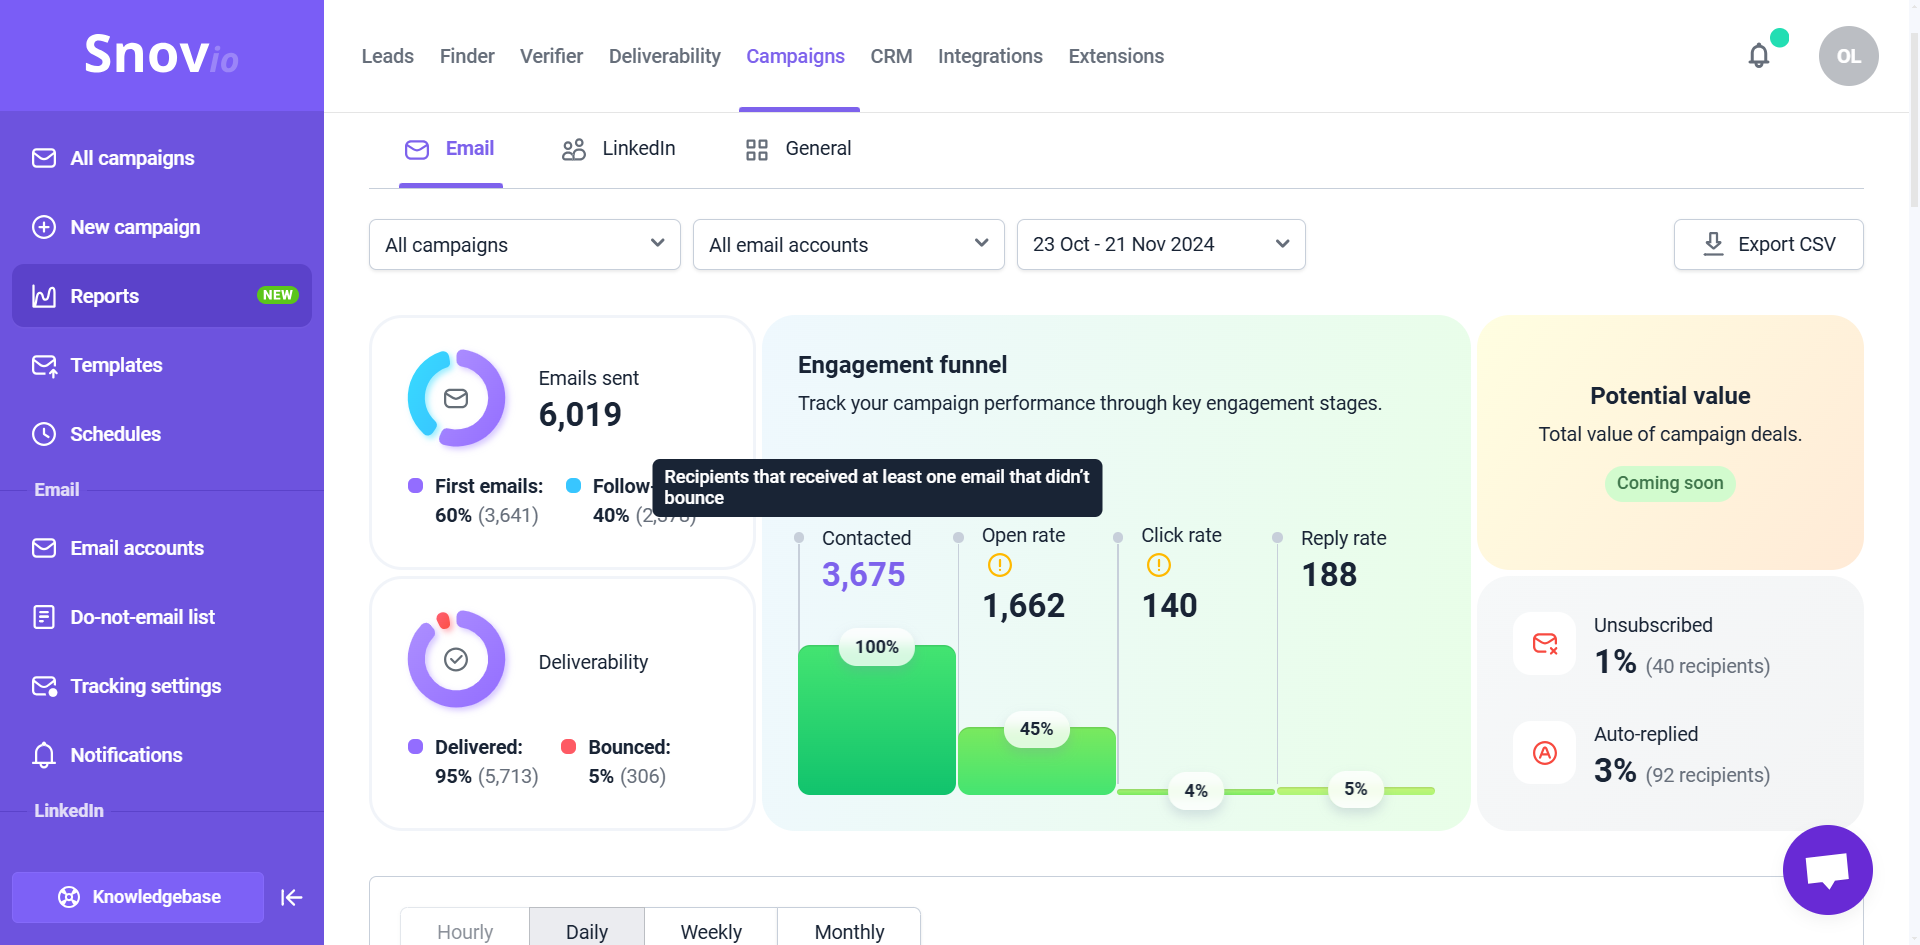
In the Email report, you can export data on recipients you contacted and those who took specific actions in your email campaigns: opened an email, clicked a link, or replied.
The following metrics can be exported:
- First emails – Recipients who received the initial email in a campaign sequence within the selected time period
- Follow-ups – Recipients who received at least one follow-up email
- Delivered – Recipients who received at least one email that hasn't bounced
- Bounced – Recipients whose emails couldn't be delivered due to errors
- Contacted – Recipients who received at least one email that didn’t bounce
- Open rate – Recipients who have opened at least one email
- Click rate – Recipients who clicked a link in an email
- Reply rate – Recipients who replied to at least one email
To export data, click the number representing a statistic to open the list of recipients associated with that metric.
You can also export recipient lists for the Unsubscribed and Auto-replied metrics. Click the recipient count next to these metrics to view and export the list.
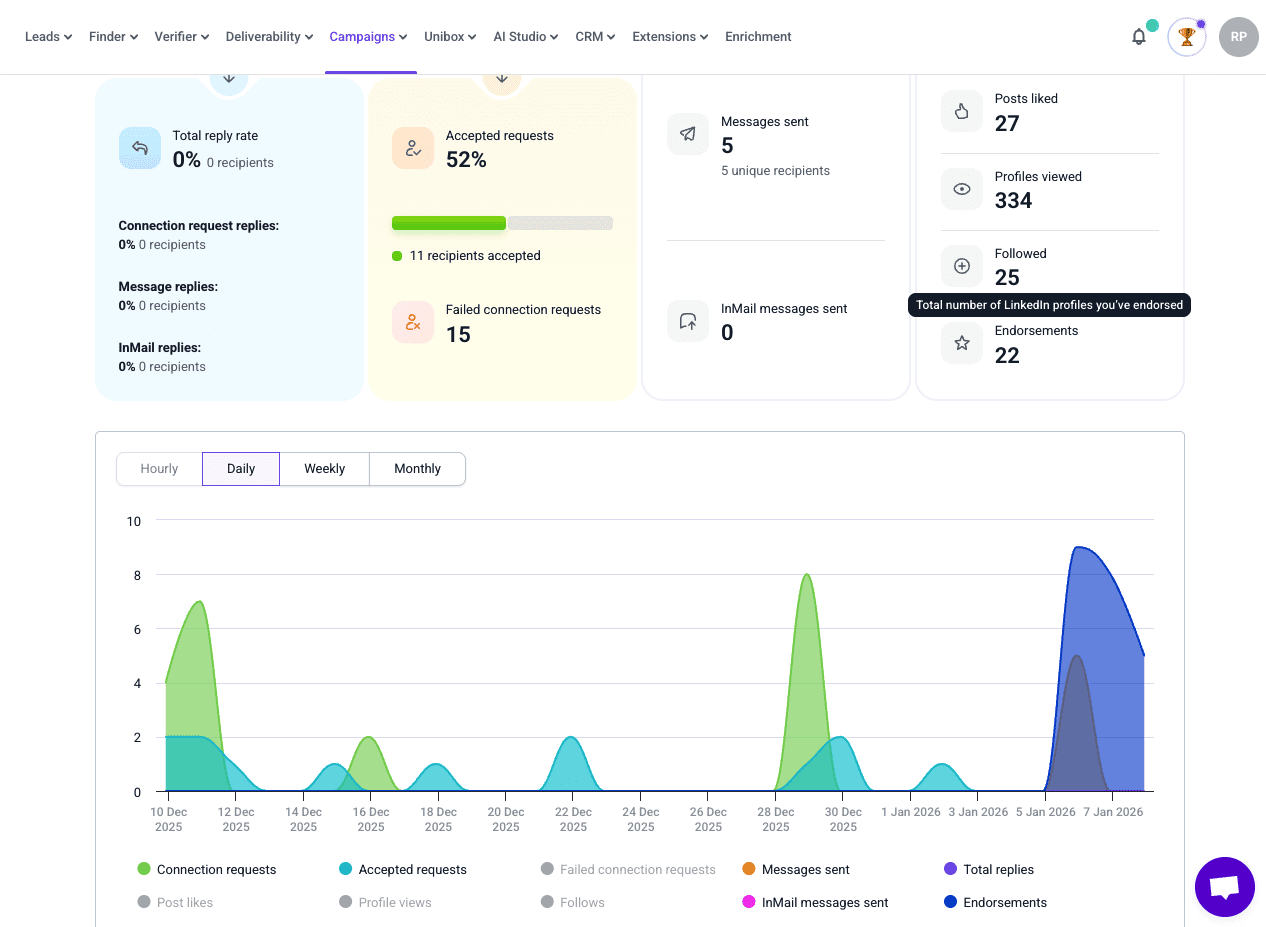
The KPIs for export in the LinkedIn report
On the LinkedIn report, you can export recipient data for every activity in your LinkedIn automation and lists of recipients who accepted requests or replied to any of the messages.
- Contacted: Recipients contacted through a connection request or message
- Total reply rate: Recipients who replied to regular messages, connection requests, or InMails
- Connection requests: Recipients to whom a connection request you sent was successful or failed, and who accepted it
- Messages: Recipients to whom you sent at least one message and the total number of messages sent
- LinkedIn activity: Prospects whose profiles you viewed, followed, whose posts you liked, or whose skills you endorsed
Click the number showing the statistic for any of the metrics to open its recipient list. For example, the export for Accepted requests includes prospects who accepted the LinkedIn request you sent during the selected time period.
The KPIs for export in the General report
On the General report, you can export data for recipients who participated in your multichannel campaigns or were contacted through both email and LinkedIn in separate campaigns.
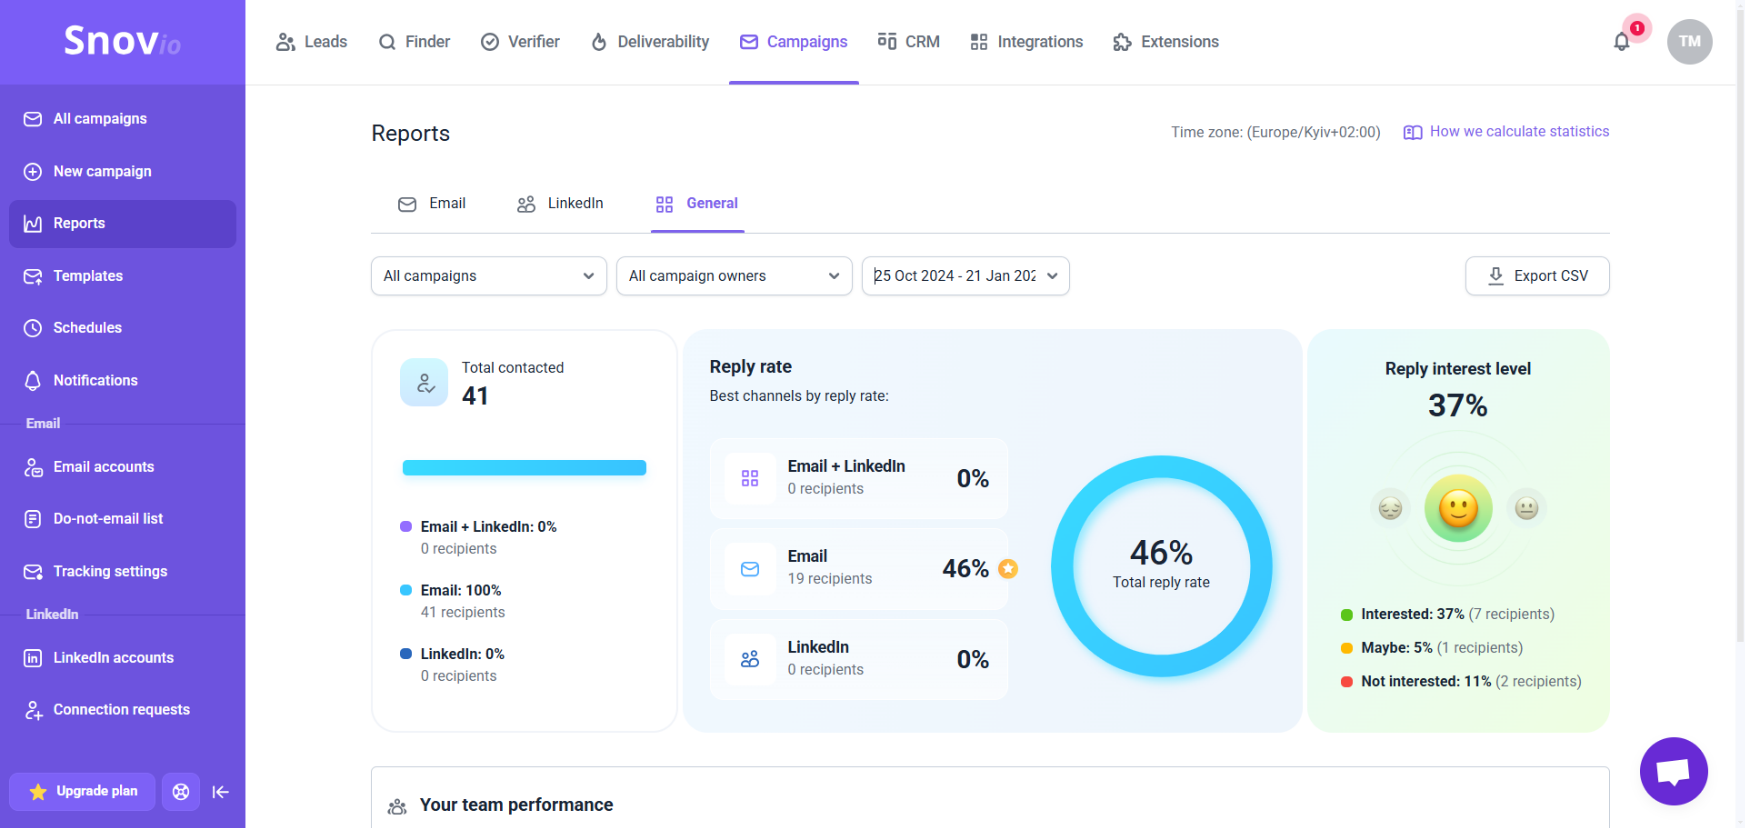
- Total contacted: Data for recipients contacted by both channels: by email and LinkedIn message or connection request
- Reply rate: Data for recipients who replied after being contacted by both channels: by email and LinkedIn message or connection request
- Reply interest level: Data for recipients who replied and had an interest level assigned manually or automatically. It includes statistics for all three interest levels: Interested, Maybe, and Not interested
To export data for a specific metric, click the recipient number next to it to open the list of matching recipients. You can then download the list as a CSV file. The general CSV export will also include this data.
Export recipient data from activity charts
This section of the report visualizes campaign events and recipient actions over time. The chart displays trend lines for the metrics you select, reflecting their volume over the chosen time period.
To adjust data in the chart:
1) Select a time period at the top. Based on the time frame you choose, the chart will be divided into sections: hours, days, weeks, or months. This shows the volume of activities throughout that period.
A shorter time frame shows short-term trends. A longer period shows broader patterns in your outreach.
2) Choose metrics from the options at the bottom. The chart will show them side by side, helping you compare their volumes.
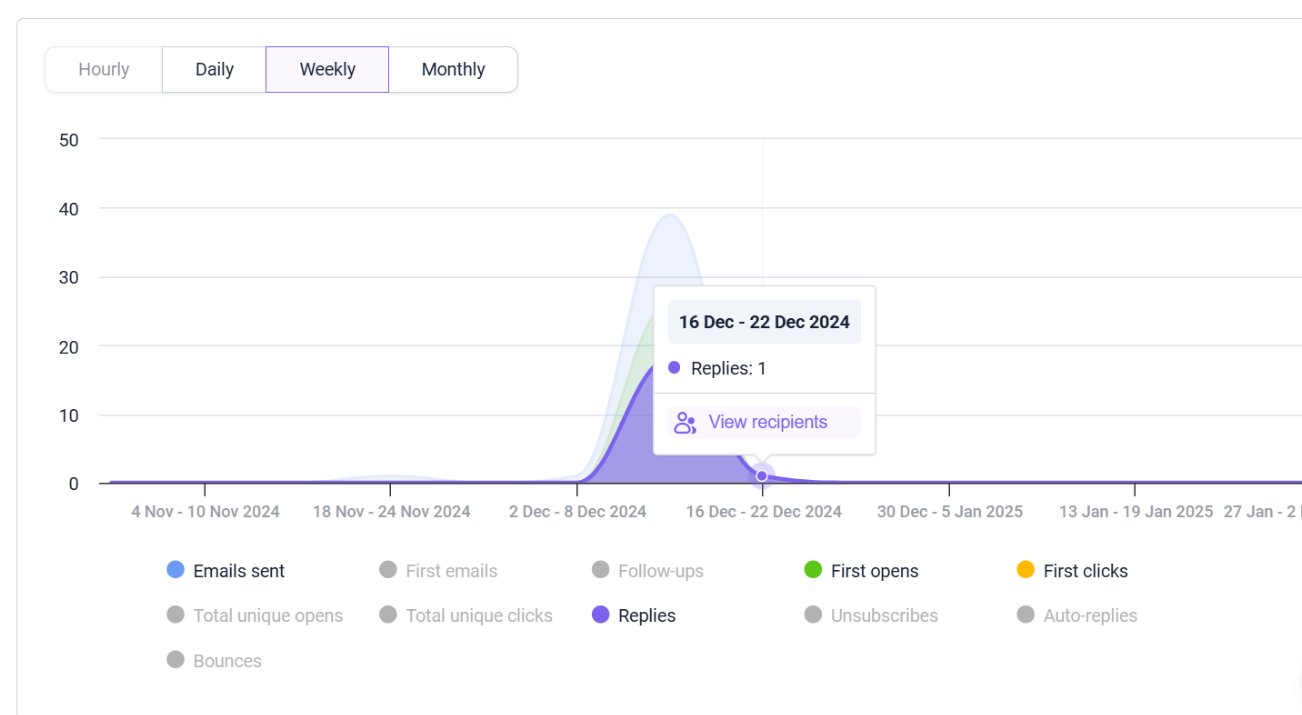
The selected data points will be shown on the chart, indicating the exact time period in which they occurred and their volume.
Exportable data points in the Email activity chart:
- Emails sent: The total number of emails sent during the selected time period
- First emails: The number of initial emails sent from a sequence
- Follow-ups: The number of follow-up emails sent from a sequence
- First opens: The number of times recipients opened an email from the sequence for the first time
- First clicks: The number of times recipients clicked a link in an email from the sequence for the first time
- Total unique opens: Counts each recipient’s first email open within the selected time period. Multiple opens by the same recipient in a day count as one
- Total unique clicks: Counts each recipient’s first link click within the selected time period. Multiple clicks on the same link in a day count as one
- Replies: The number of replies received from prospects
- Unsubscribes: The number of recipients who clicked the unsubscribe link
- Auto-replies: The number of automated responses received
- Bounces: The number of email delivery errors that were tracked into the report
Exportable data points in the LinkedIn activity chart:
- Connection requests: A volume of sent connection requests for the selected time period
- Accepted requests: A volume of connection requests that were accepted during the selected time period
- Failed connection requests: A volume of unsuccessful connection requests for the selected time period
- Messages sent: A volume of sent LinkedIn messages for the selected time period
- Total replies: A volume of recipients who responded via LinkedIn during the selected time period
- Post likes: A volume of post likes during the selected time period
- Post views: A volume of profile views during the selected time period
- Follows: A volume of profile follows during the selected time period
- Endorsements: A volume of skill endorsements during the selected time period
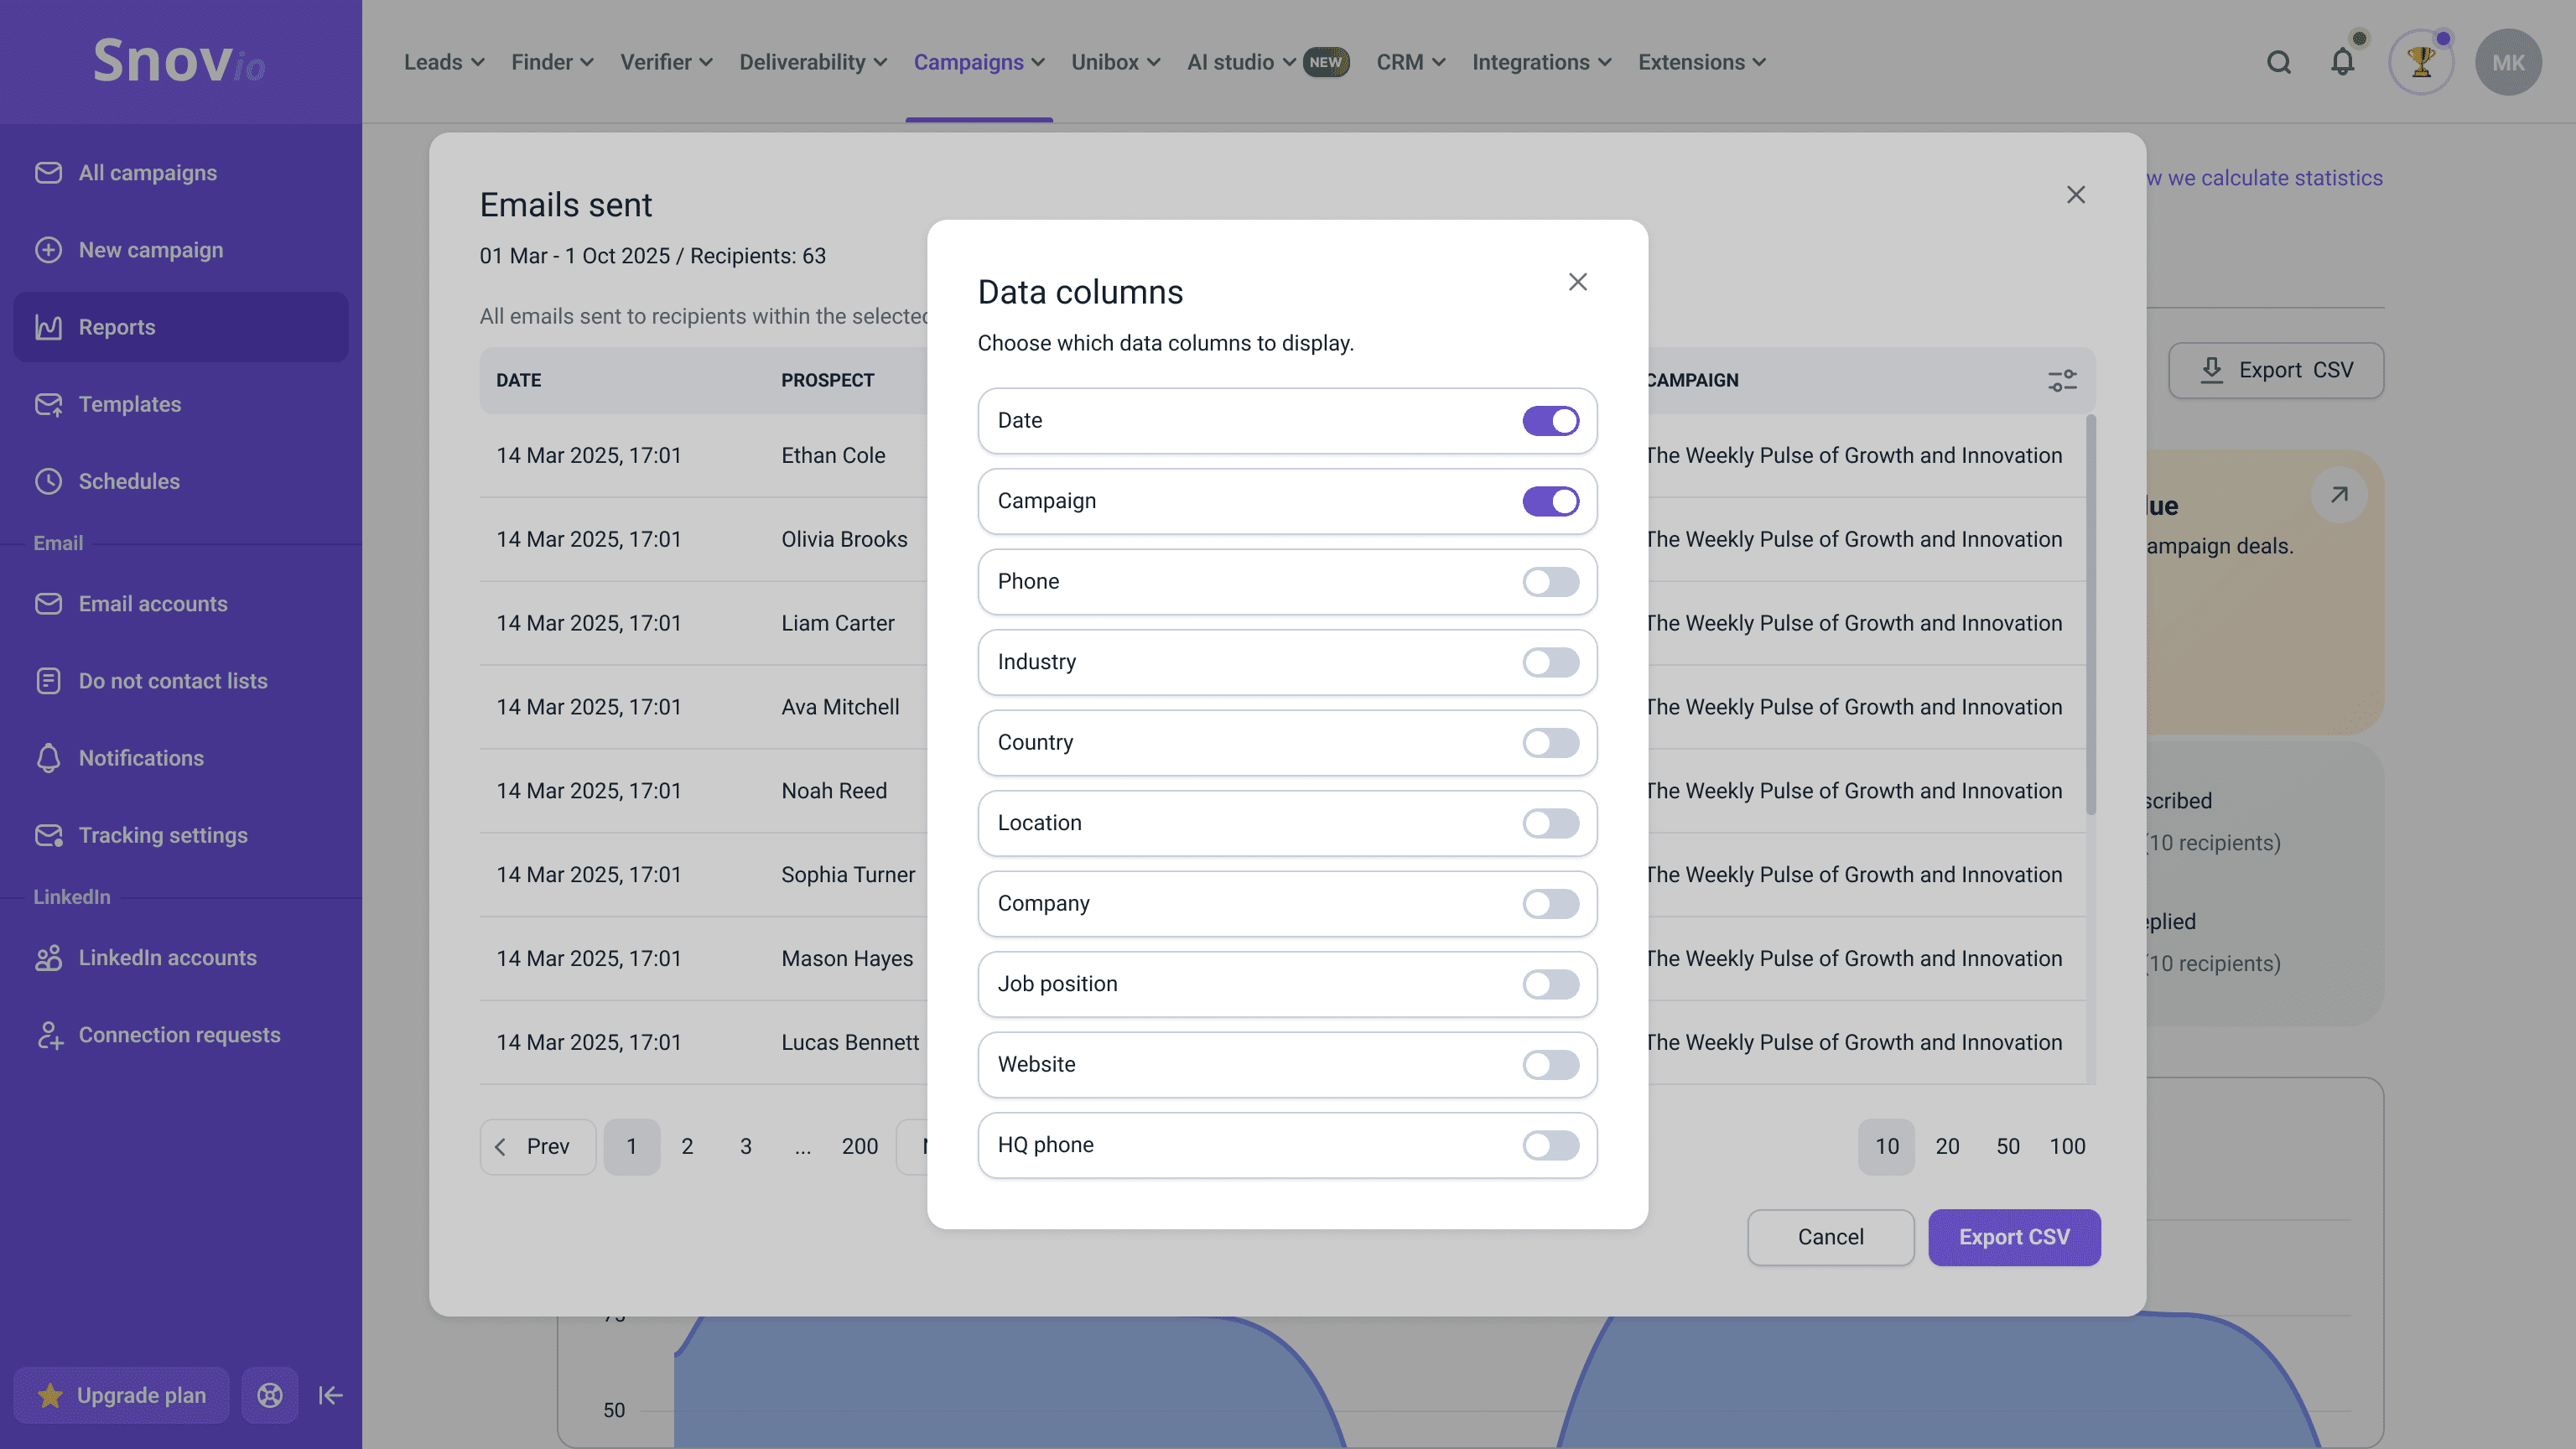
Export recipient data
You can export detailed recipient data for each metric in your reports. Hover over a data point and click View recipients to open the list of prospects tied to the selected metric.
To choose which recipient data appears in the final export, enable the columns you need from the Data columns menu in the top-right corner.
You can include the following recipient fields in the export:
- Date
- Campaign
- Phone number
- Industry
- Country
- Location
- Company
- Job position
- Website
- HQ phone

Sorry about that 😢
How can we improve it?