Outline:
Statistics help you optimize sales performance and guide decision-making to build a profitable business strategy.
Snov.io CRM includes a statistics summary to analyze your work results based on deal history.
This report includes:
- Number of deals created/won over a period of time
- Total value of won deals
- Performance of each team member
- Deal loss reasons
Where to find Deals statistics
In the left menu, go to CRM → Statistics or follow the link.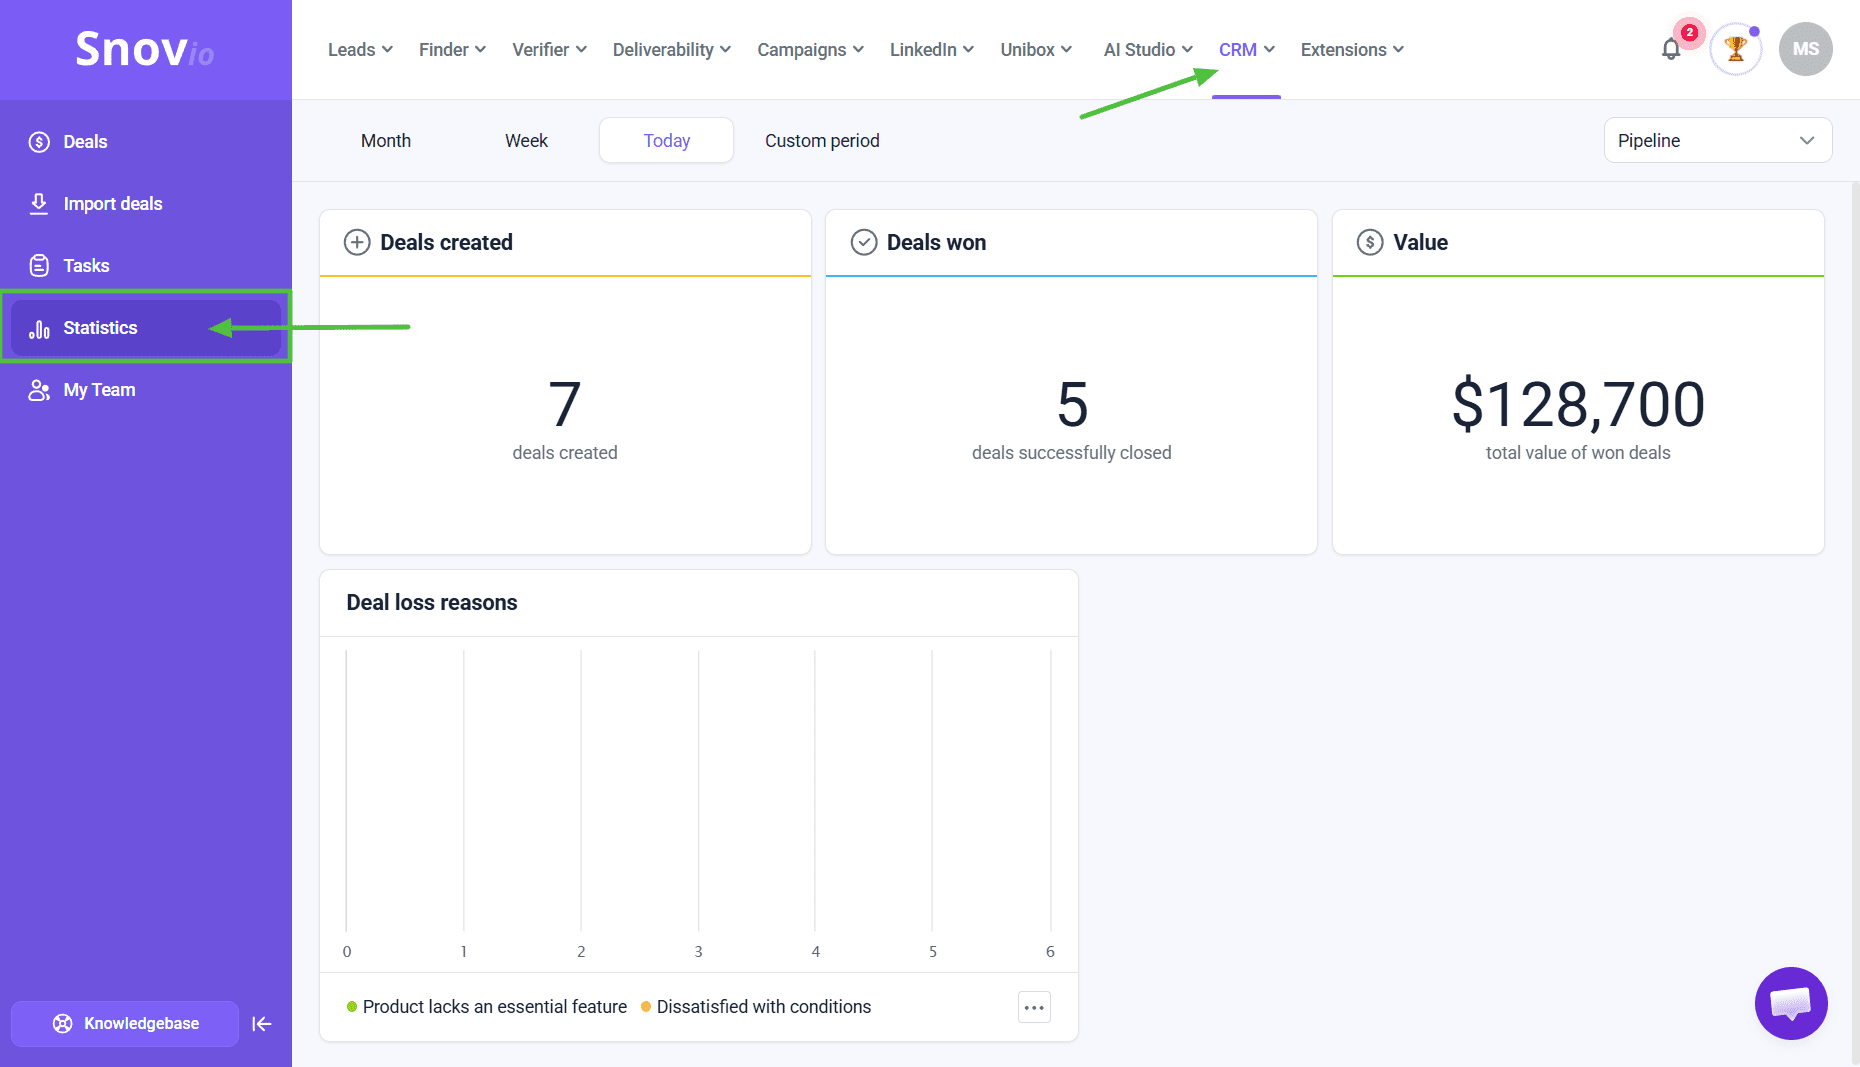 You'll see the Deals statistics page with these metrics:
Deals created (1), Deals won (2), Value (3), Team statistics (4), Deal loss reasons (5).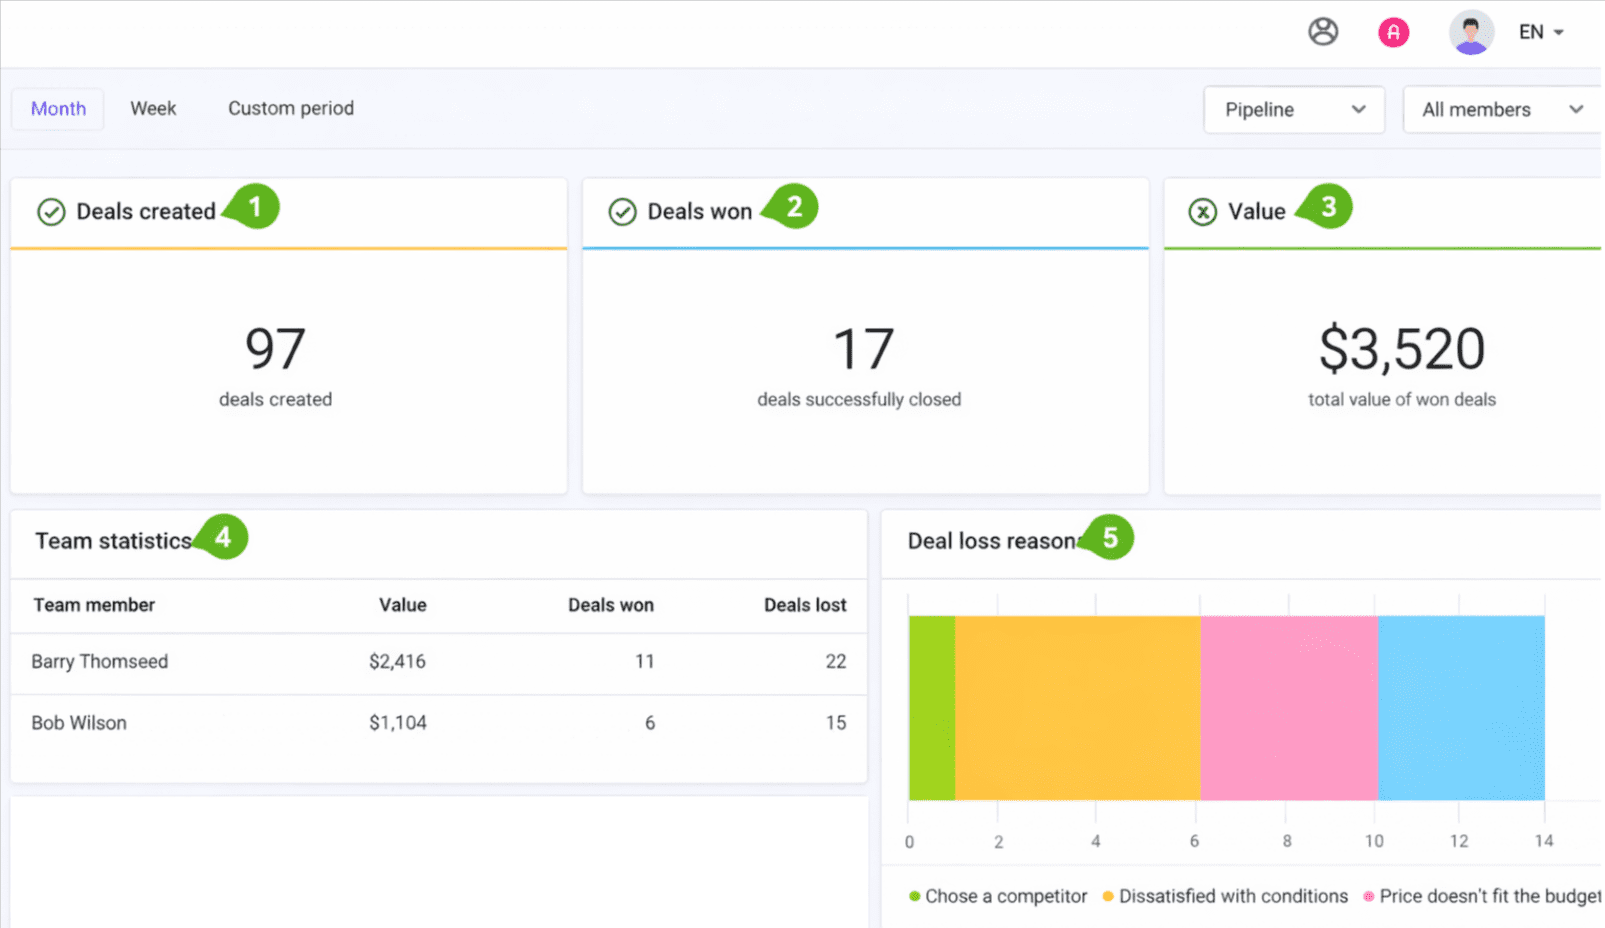
Statistics filtering
The toolbar at the top lets you filter statistics by:
- Time
Set a time filter to view statistics for a specific period.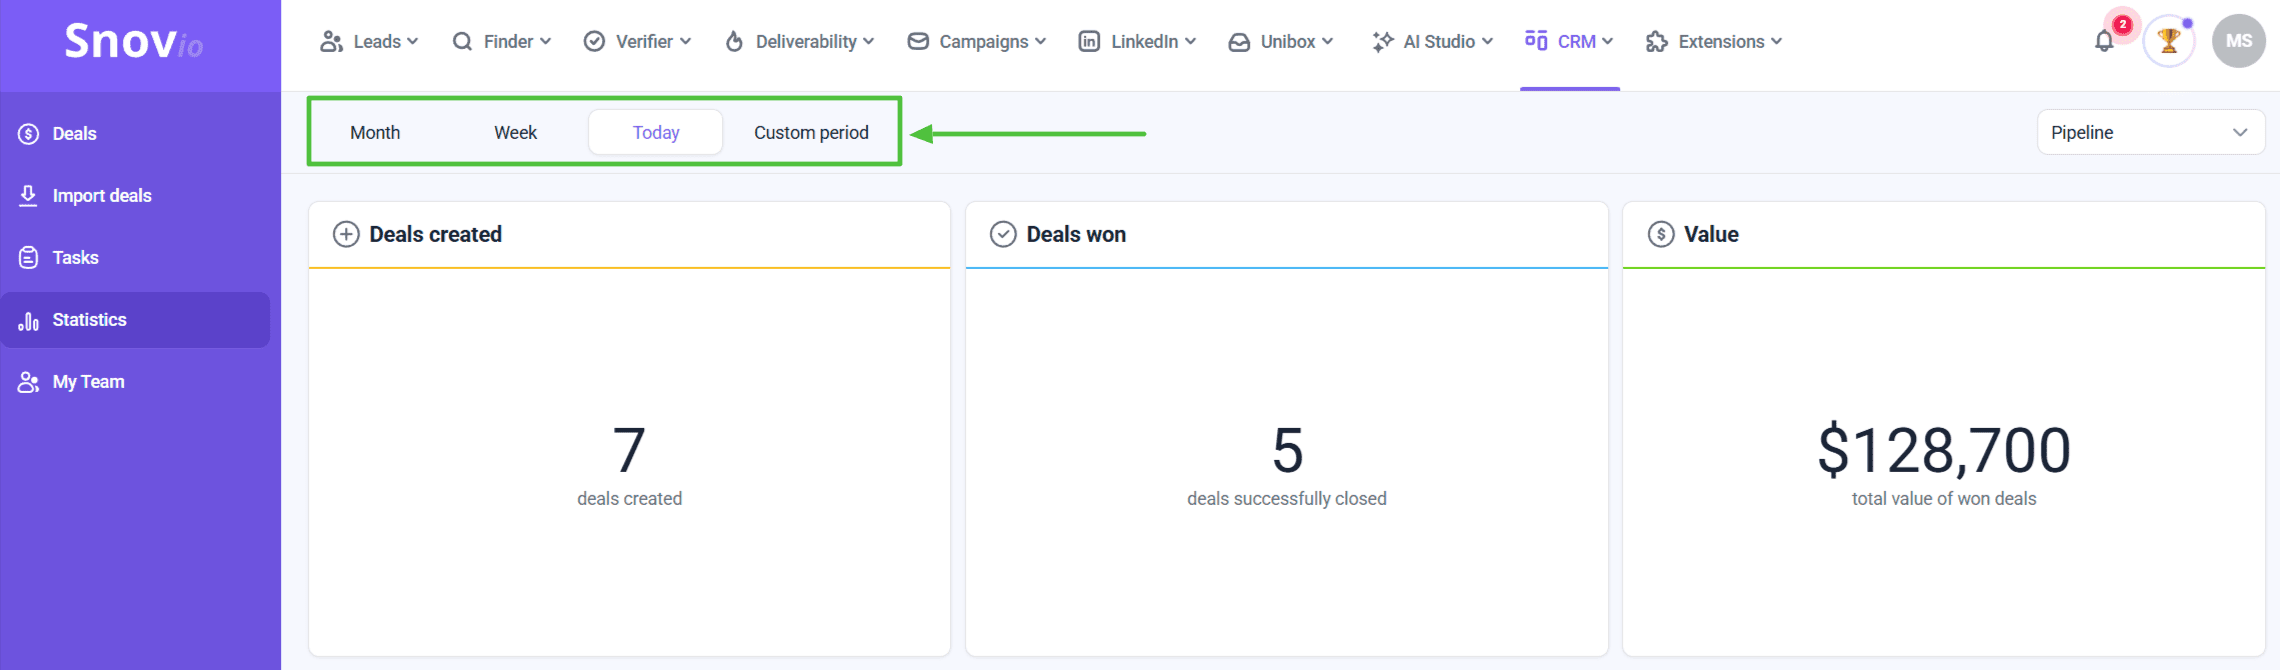
2. Pipeline
If you have multiple pipelines, view statistics for all pipelines or choose a specific one.
This helps determine which pipelines perform better and which sales approach works best for your audience.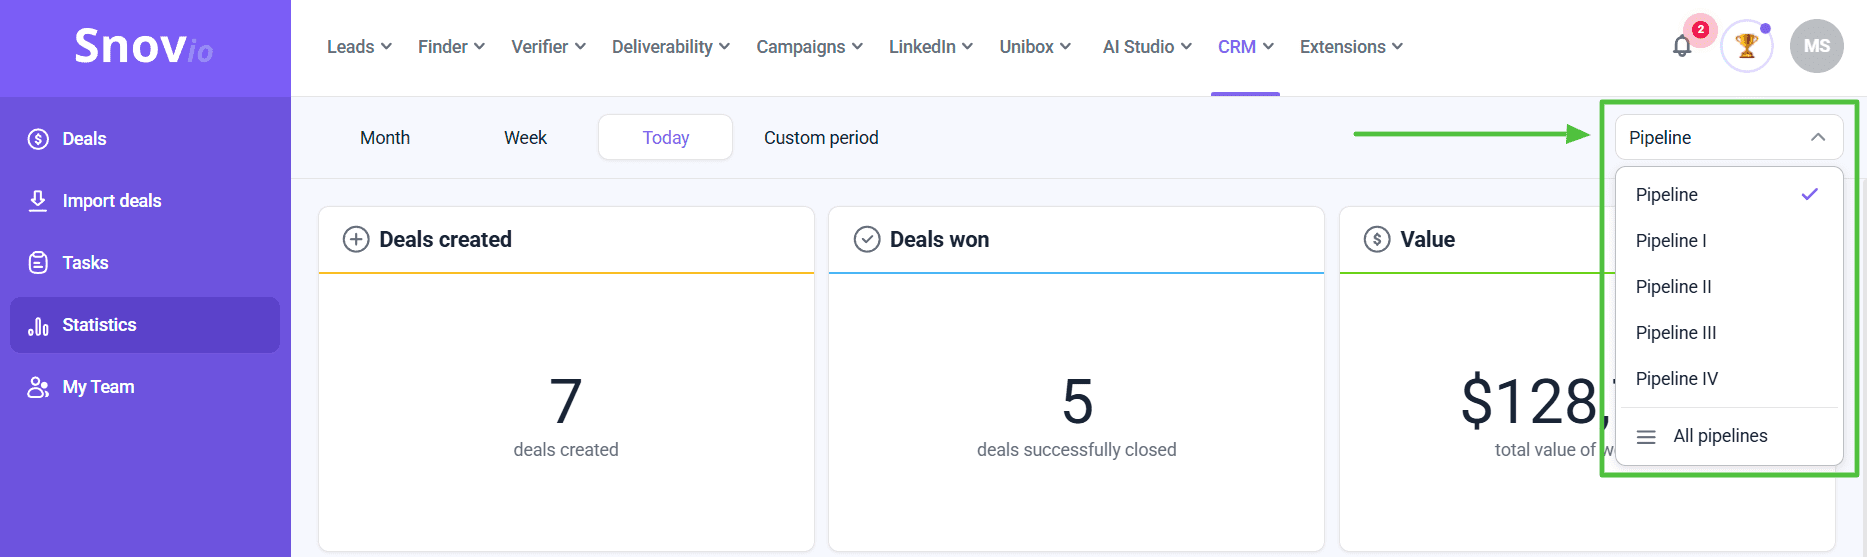
- Team member
If you use Snov.io CRM in a Team, this filter helps monitor the progress of a specific team member.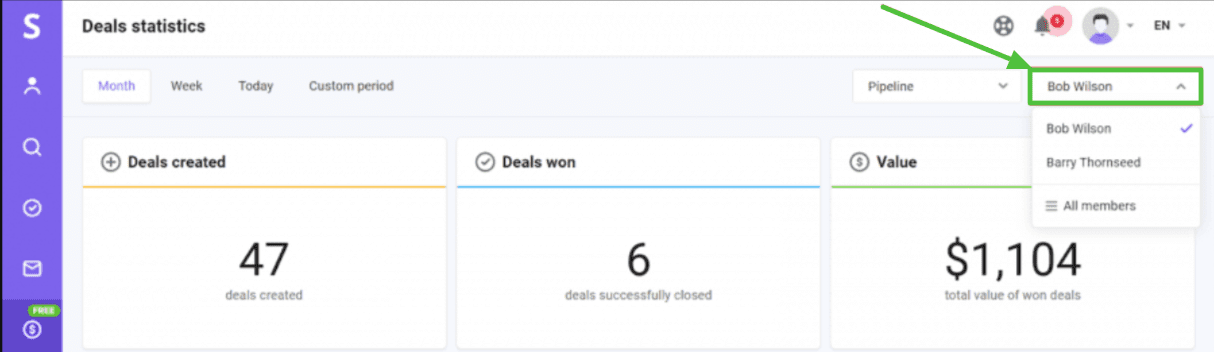
Deal loss reasons statistics
The graph in the bottom right corner shows the most common reasons behind lost deals. Customize the list of deal loss reasons to suit your needs and get more specific insight into customer desires.
Hover over the graph to see the full list of deal loss reasons and the number of lost deals per reason.
Feel free to contact our support team via live chat or email us at help@snov.io for any additional questions.


Sorry about that 😢
How can we improve it?