TL;DR:
So, how do you measure email deliverability? Here’s a short, at-a-glance version of this guide with the key points covered.
| Point | Explanation |
|---|---|
| How-to-measure instruction | Step 1. Check SPF, DKIM, and DMARC as a preparatory step. Step 2. Ensure that your IP and/or sending domain aren’t blacklisted. Step 3. Run an inbox placement test with a seed list and calculate your deliverability rate. Step 4. Segment results by mailbox provider, campaign, email template, or other factors. Step 5. Audit and fix deliverability issues based on the received data. Step 6. Organize regular monitoring with alert thresholds. |
| Formula to calculate deliverability | (Seed emails in inboxes ÷ total seed emails sent) × 100 = Inbox placement rate |
| Best email deliverability tools | Snov.io’s Deliverability Check, GlockApps, GMass Inbox Tester, MXToolbox, Mail-Tester |
| What is a good email deliverability rate? | 95–98% |
| Other impactful email deliverability metrics to track | Most essential: Spam complaint rate, bounce rates, sender score, domain reputation score Indirect but not less critical: Response rates, unsubscribe rates Indirect but the least reliable: Open rates, click rates |
Got a few more minutes to dig deeper into the subject? Let’s go!
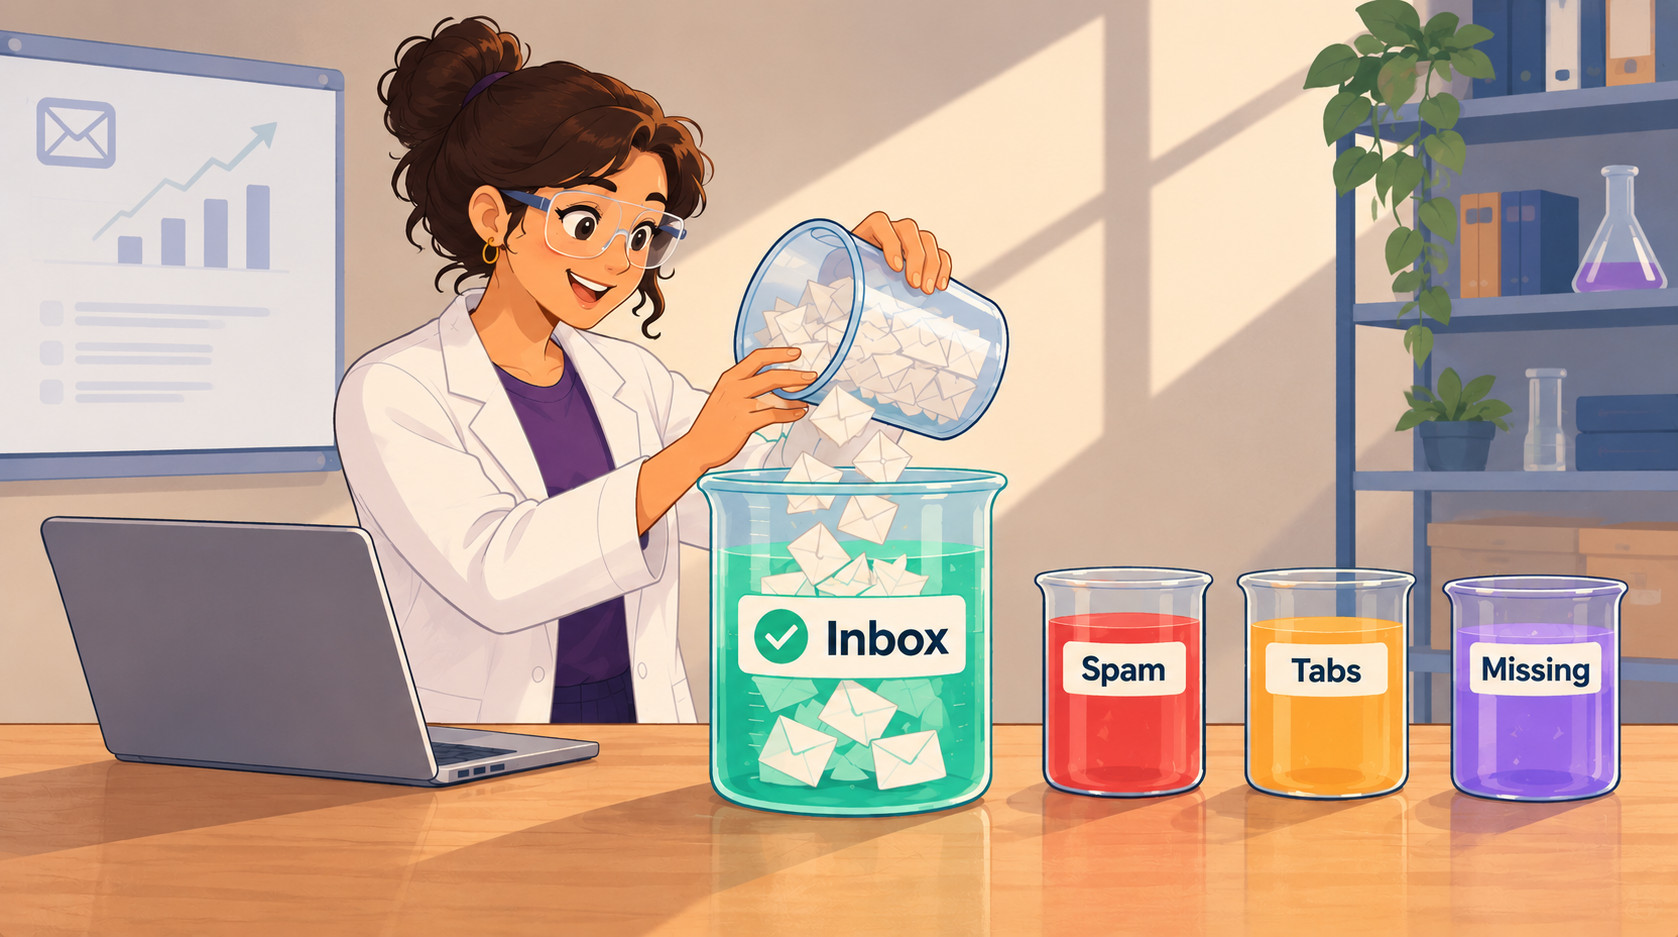
Some of your emails land in irrelevant tabs or, worse, spam folders. Others seem to disappear into a black hole, while only a portion reach the inbox.
And this isn’t just your problem. The average email deliverability rate worldwide is 87.2%. How does yours compare?
In this guide, let’s take a closer look at how to measure email deliverability accurately.
Email deliverability rate vs delivery rate: What are you tracking?
First, let’s make sure you’re using the right denominator. These two terms are often confused, which can lead to a major mistake from the start. To avoid that, let’s distinguish between email delivery and email deliverability rates:
- The delivery rate is a metric that determines whether the receiving email server accepted each message
- The deliverability rate (or the inbox placement rate) is a metric that tells whether each message reached precisely the inbox, not the spam folder (e.g., the Junk folder in Outlook) or any other tab (e.g., the Promotions tab in Gmail), and wasn’t silently deleted/quarantined and disappeared altogether
So, even if mailbox providers like Gmail, Yahoo Mail, or others accept your messages on the server side, they can still delete, quarantine, or direct them to your recipients’ spam folders or tabs. In this case, they count as “delivered,” but people don’t see them in their inboxes.
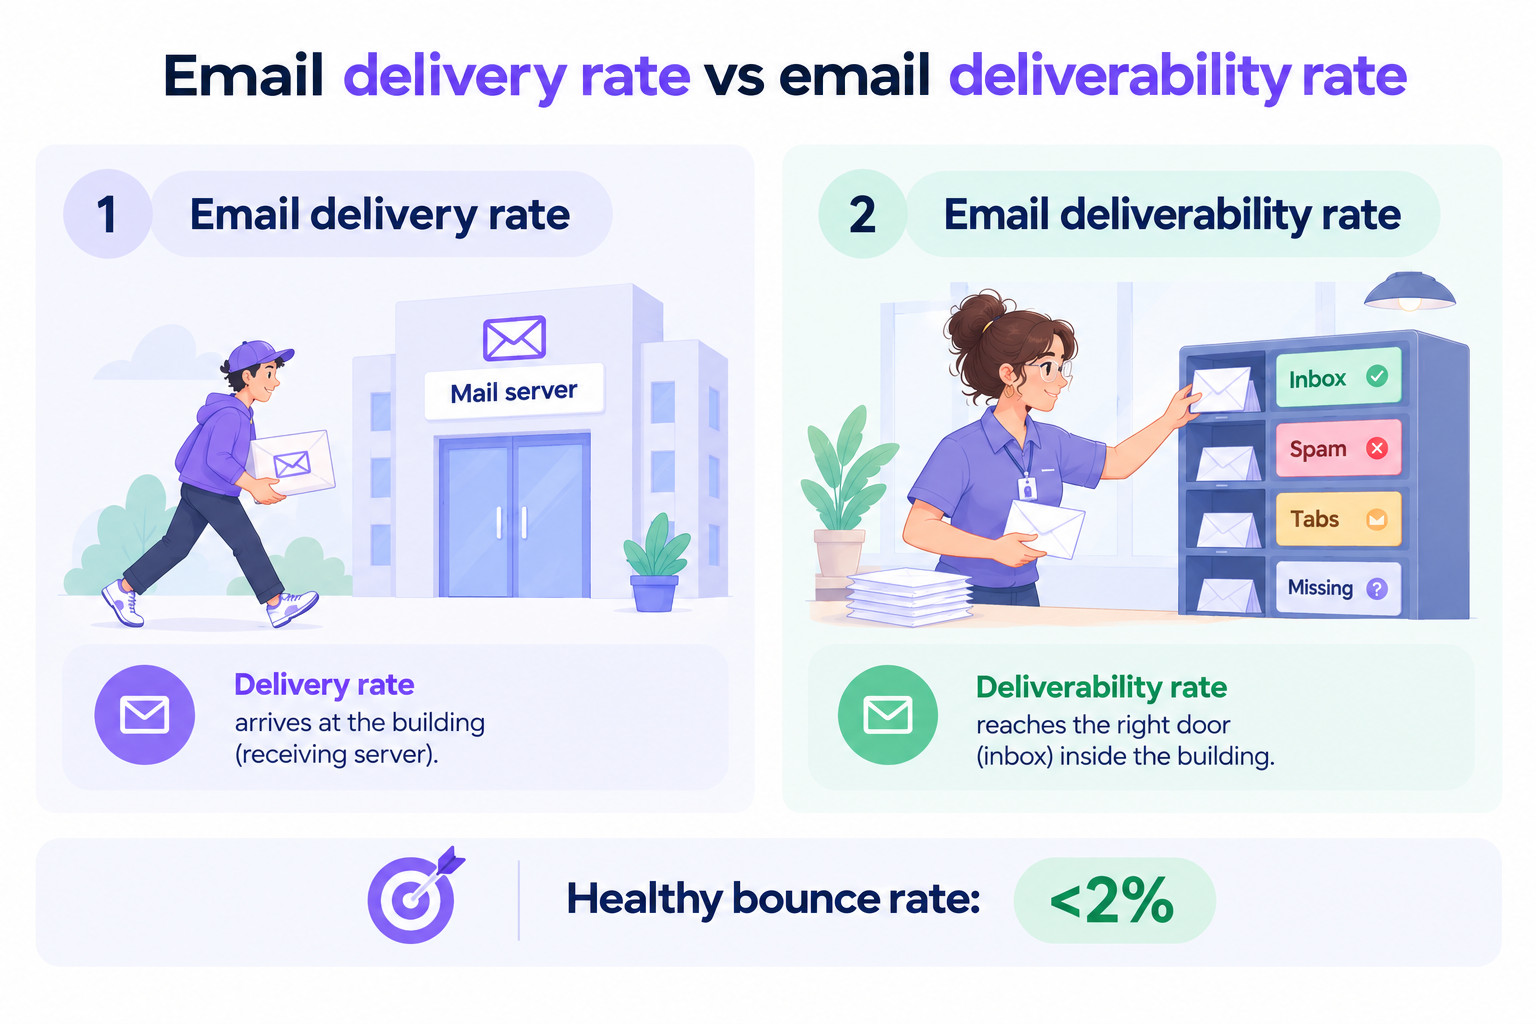
For easier comparison, I’ve put them side by side in the table below, with key differences and formulas for calculating each metric.
| Email delivery rate | Email deliverability rate | |
|---|---|---|
| Main question it answers | Did the receiving server accept the message? | Did the message reach the inbox? |
| Decided by | Receiving servers | Spam filters by email service providers (ESPs) or recipients’ own filtering rules |
| Formula to measure it | (Emails delivered ÷ emails sent) × 100 | (Emails in inbox ÷ emails sent) × 100 |
| Related metrics | Bounce rates: Soft bounce rate for soft bounces and hard bounce rate for hard bounces | Tab placement rate, spam folder placement rate, missing rate |
| Does it count landing in spam folders as success? | Yes✅ | No❌ |
Suppose you’ve sent 1,000 emails, and receiving servers accepted 990 of them. Your result is then: 990 ÷ 1,000 × 100 = 99%, which is a good delivery rate.
At the same time, an inbox placement test shows merely 450 reached inboxes, and 540 went to spam. Your email deliverability rate is then: (450 ÷ 990) × 100 = 45%, which isn’t even an average number.
How do you measure email deliverability step by step?
Let’s find out your actual email deliverability rate by following these steps.
Step 1. Verify your authentication protocols: SPF, DKIM, DMARC
Before measuring your inbox placement rate, check whether your SPF, DKIM, and DMARC records are in place and properly configured. If at least one of these protocols is misconfigured, your results won’t be reliable.
Here’s what each means:
- Sender Policy Framework (SPF) is a DNS record responsible for authorizing an IP address (or several IPs) to send emails on behalf of your domain
- DomainKeys Identified Mail (DKIM) is a DNS record that contains a cryptographic signature to guarantee that email content isn’t modified during delivery
- Domain-based Message Authentication, Reporting, and Conformance (DMARC) is a DNS record that decides how to act on messages that fail SPF and/or DKIM verifications
To inspect each in detail, opt for dedicated record checkers.
For example:
Snov.io’s DMARC Checker can help you confirm DKIM and SPF alignment and make sure it passes all tests (green checkmarks), including syntax and policy enforcement.
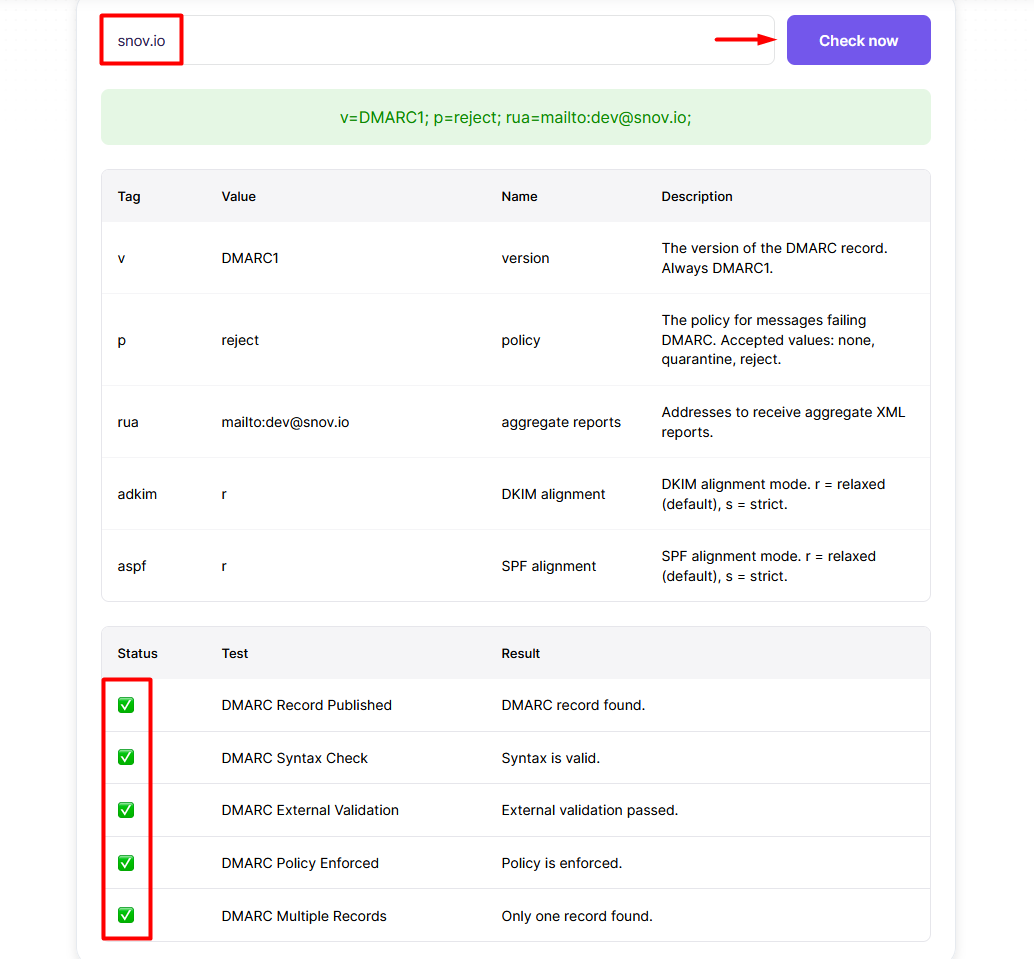
The most popular mailbox providers, such as Microsoft Outlook, Yahoo Mail, and Gmail, require bulk email senders to have all three in place. So, paying extra attention to your technical setup is particularly critical for mass cold outreach or email marketing.

Step 2. Check whether your IP or sending domain isn’t blacklisted
This is another no-skip prep step before measuring email deliverability. Ensure that neither your IP address nor your email-sending domain sits on a blacklist/blocklist like Spamhaus, SpamCop, or Barracuda.
Why? Because if it does, you’re very unlikely to bypass ESPs’ spam filters and, consequently, spam folders. There’ll be no point in running an inbox placement test.
For that, use a blacklist checker by Snov.io, MXToolbox, Spamhaus, Snov.io, or others.
These tools cover only public blacklists. Mailbox providers like Outlook or Gmail also use internal filtering systems that aren’t publicly accessible. So “No records found” is a positive signal, but not a 100% guarantee.
If your domain or IP address does appear on a public blocklist, do the following:
- Write down the reason (most blacklist tools clearly indicate it)
- Address the reason you were blacklisted (e.g., malware links in emails or any other spam-like behavior)
- Carefully read the removal instructions and criteria, and request to be removed from a blacklist
The delisting process varies by blacklist, so check its specific removal requirements. For example, Spamhaus asks you to submit a request explaining what you’ve done to fix the issue. A vague explanation like “I fixed everything, please remove me from the blacklist” won’t work.
Step 3. Launch a seed-list inbox placement test
This is the actual stage when you get down to business and measure your email deliverability. One common method is seed list testing.
A seed list is a group of test email addresses from providers like Gmail, Outlook, and Yahoo Mail.
Here’s how to use one:
- Create a seed list of test mailboxes (at Gmail, Outlook, Yahoo Mail, and other ESPs)
- Send emails to them (if you want your deliverability rate to be closer to reality, test with your real subject lines and email content and the same sending account you use for email marketing or cold outreach campaigns)
- Check whether each message arrived in inboxes, junk/spam folders, tabs, or didn’t arrive anywhere at all
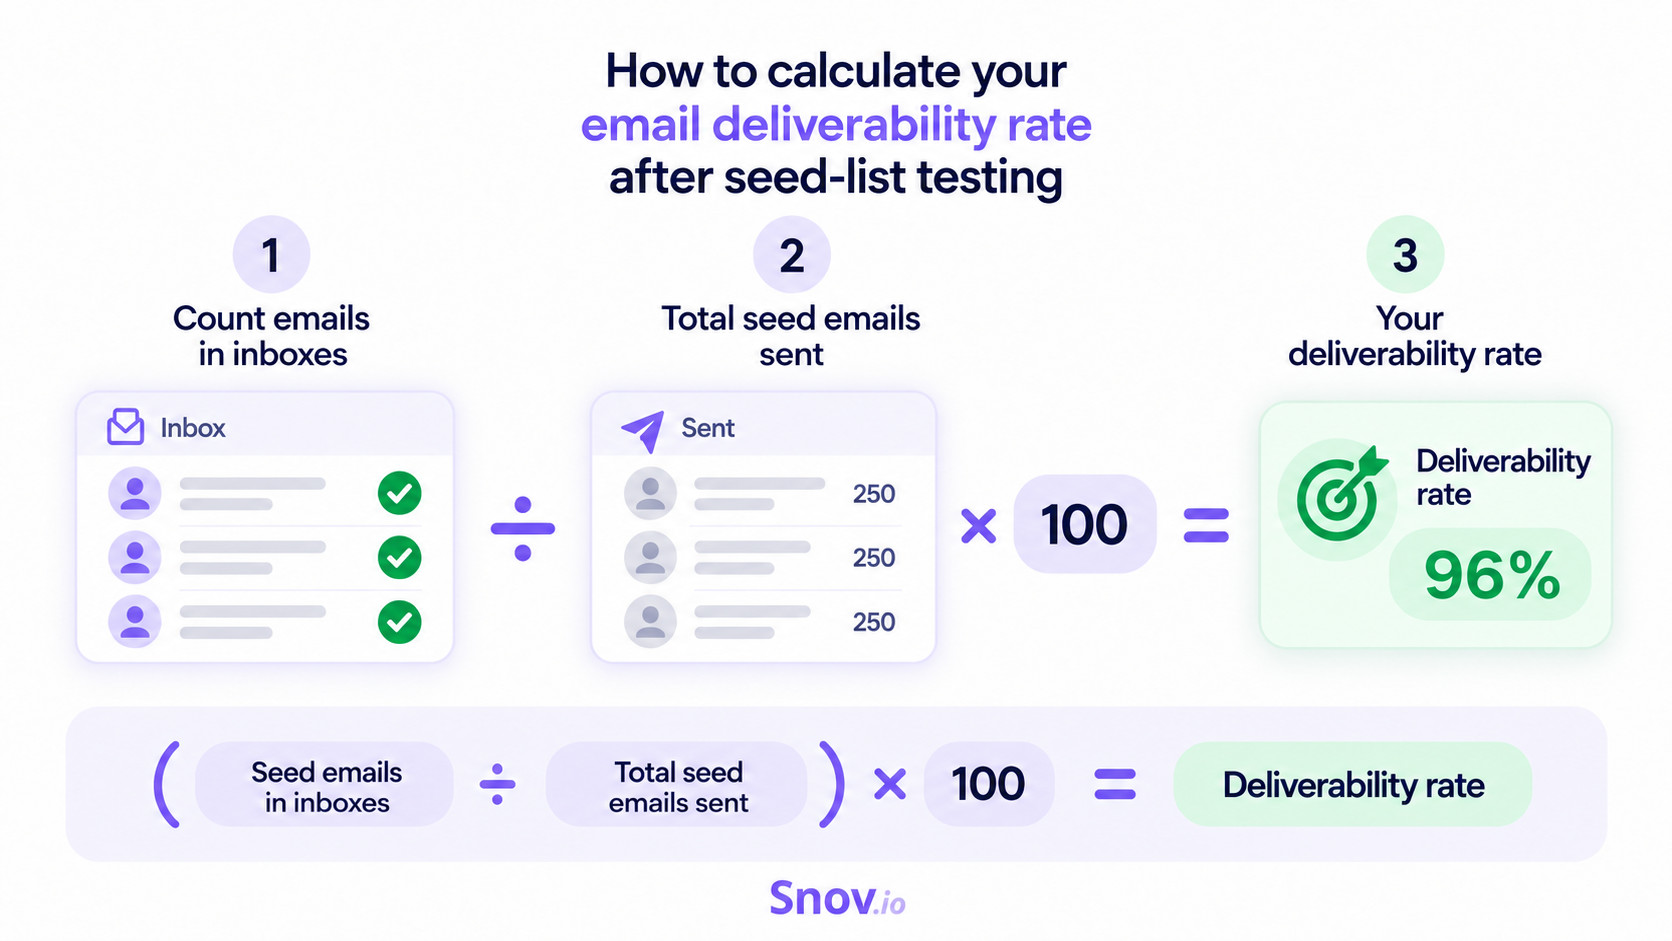
- Calculate by applying the formula: (Seed emails in inboxes ÷ total seed emails sent) × 100 = Deliverability rate
Tools like Snov.io, Mail-Tester, and GlockApps can automate these checks. Many also provide insights into domain reputation, spam scores, and email content.
For example, Mail-Tester gave me a deliverability score, details about my technical setup, and an analysis of my email content.
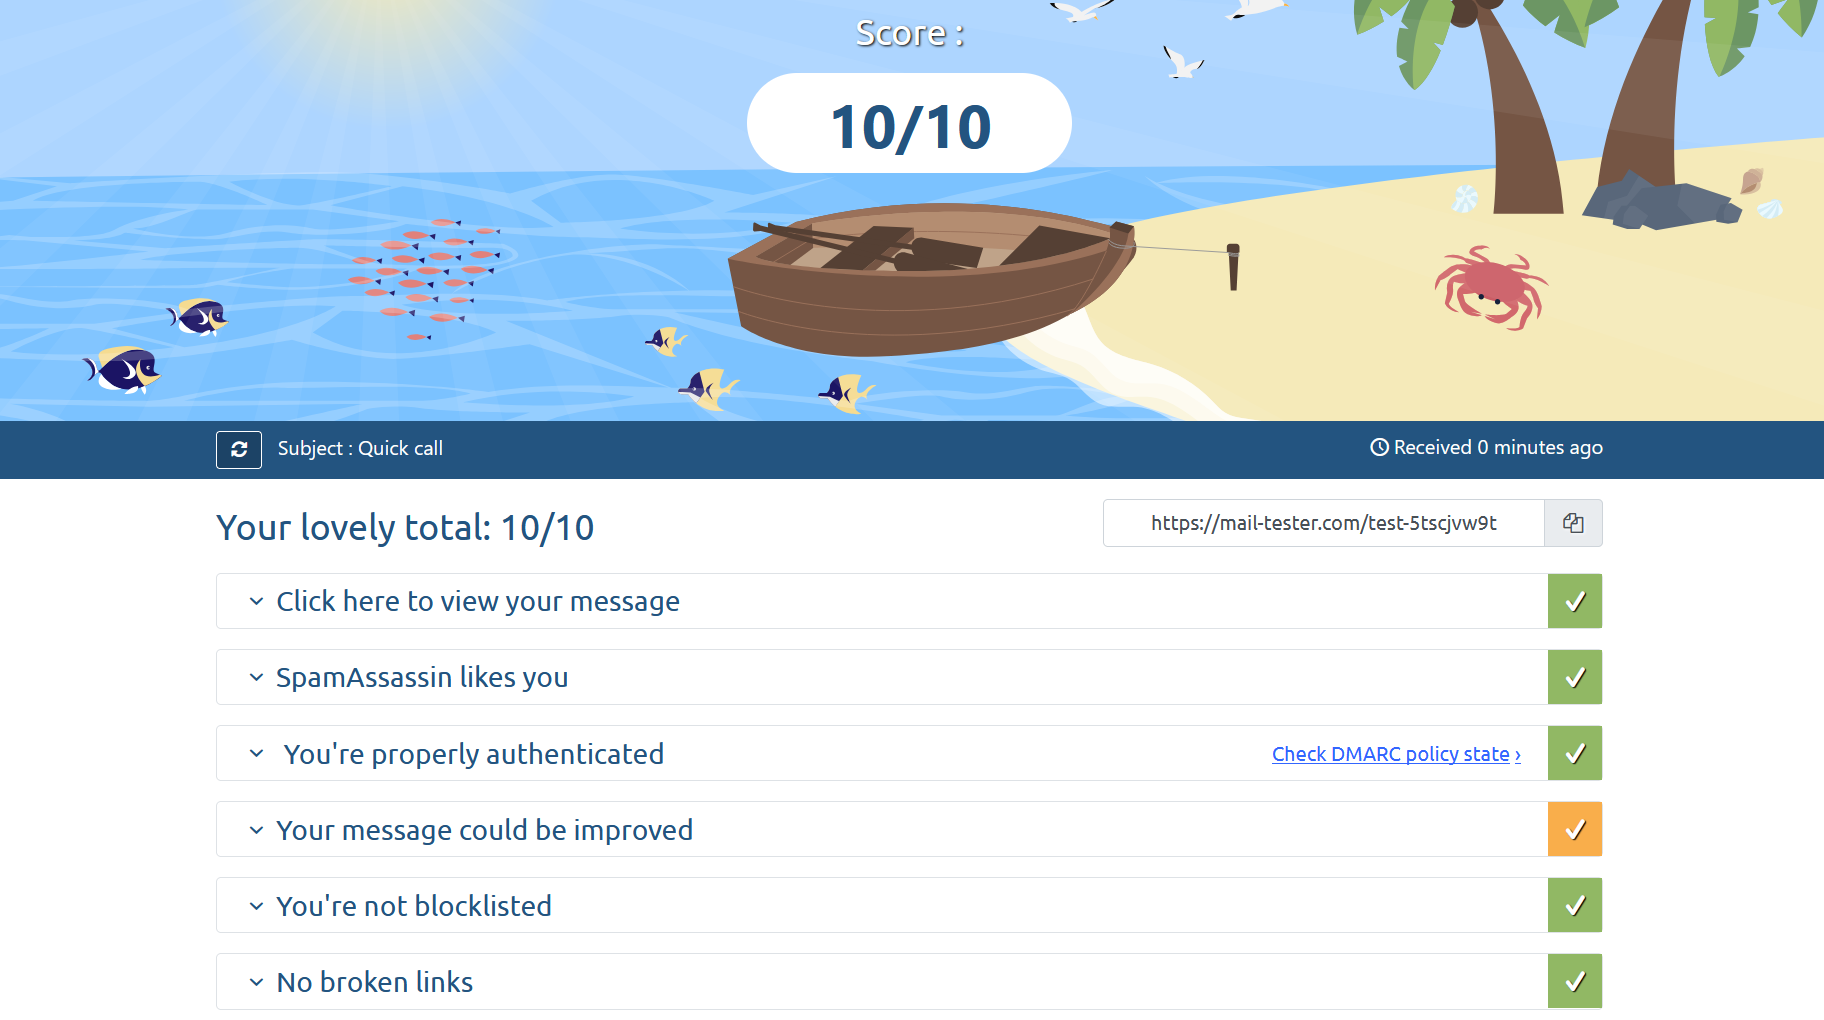
Source: Mail-Tester.com
Snov.io Email Deliverability Test offered similar insights. In a single run, it showed a 96% inbox placement rate and 100% domain health.
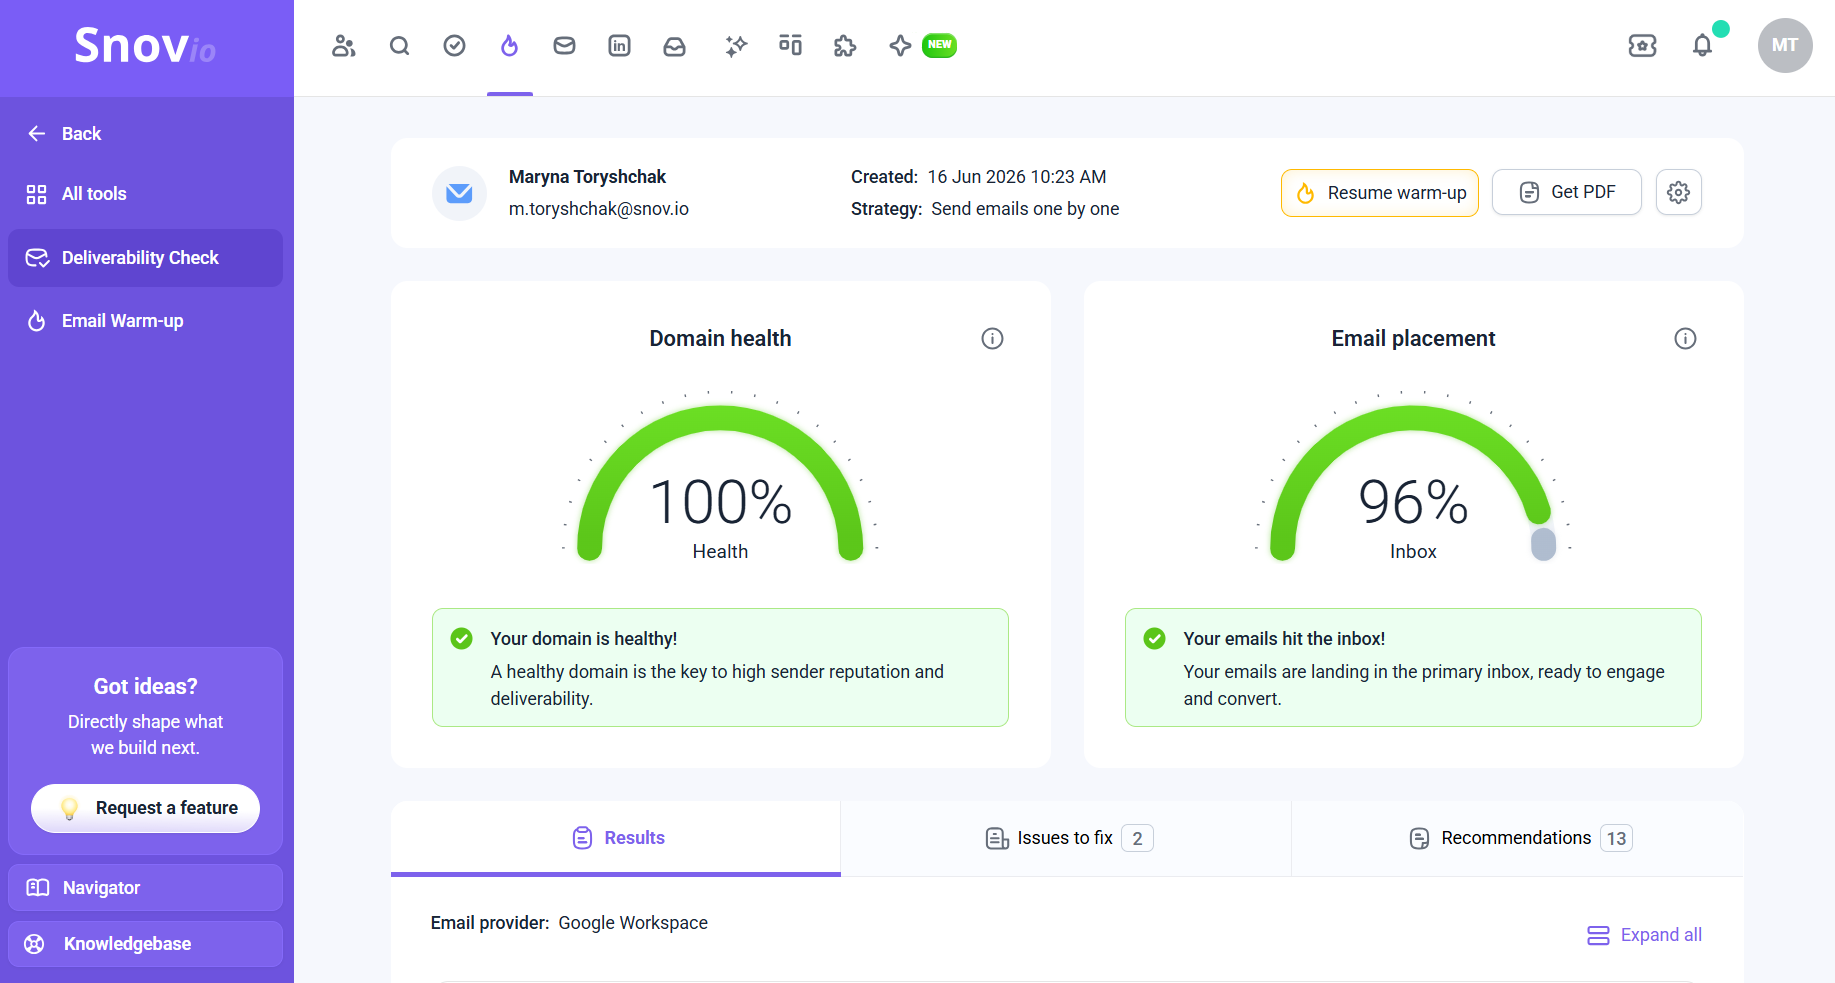
I also found more detailed results in tabs (Domain health, Email placement, Email content, SpamAssassin, Domain and IP blacklists), issues to fix, and recommendations (deliverability best practices based on the results).
Step 4. Segment results by ESP, campaign, email content, or other factors
Let’s say you get a terribly low email deliverability rate (e.g., <30%). Does it tell where the problem occurs? Nope. A single number doesn’t pinpoint the exact place where real deliverability issues are lurking.
So, after you’ve measured email deliverability, break your results down and compare them by:
- Mailbox provider: e.g., Gmail vs Apple Mail vs Yahoo Mail vs Microsoft Outlook
- Campaign type: e.g., first cold email vs follow-up; newsletter vs seasonal promo
- Email template: e.g., with vs without emojis in subject lines; with vs without links; with vs without attachments; with vs without images
- Sending domain: e.g., company.com vs trycompany.com, as different sending domains have different sender reputation
- Contact list source: e.g., inbound, scraped, event sign-ups, addresses from older databases, and so on
Say your overall deliverability rate is 78%, but it splits by provider: 92% for Gmail and 55% for Outlook. That gap tells you the problem is mostly with Microsoft’s email service.
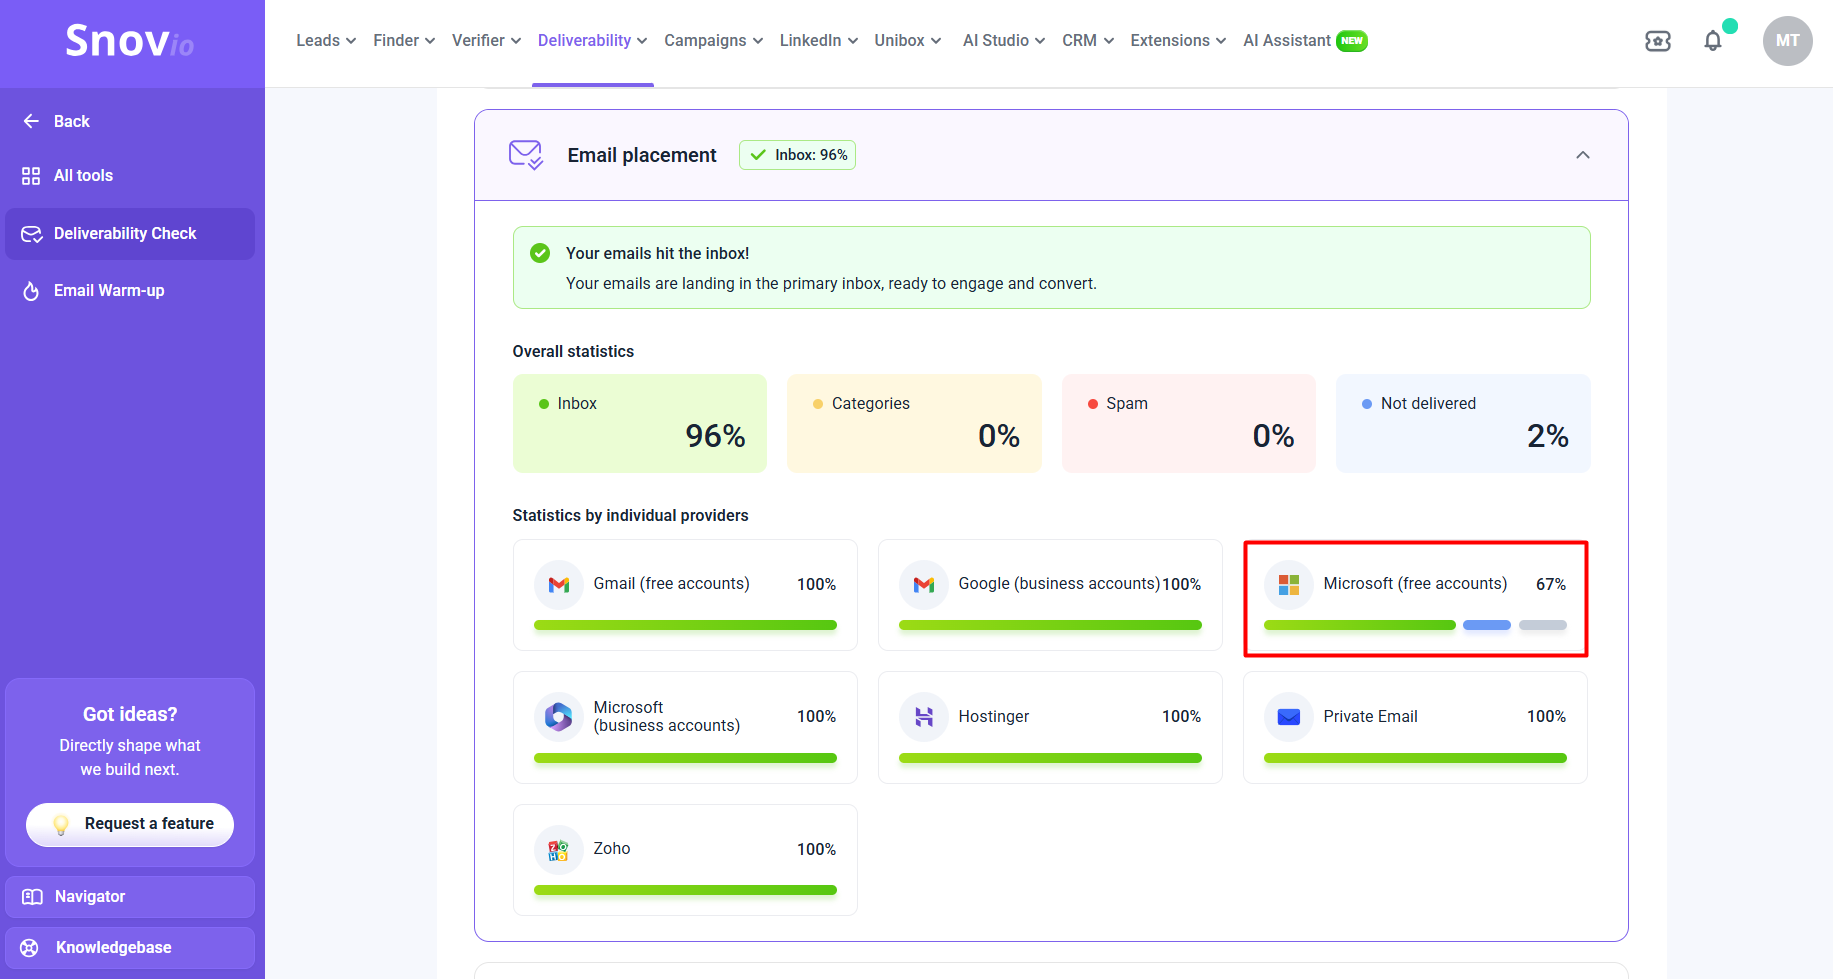
The cause could be your IP reputation, your email content, or something else that Outlook’s filters are reacting to.
Step 5. Find proper fixes for improving email deliverability
The biggest problems often hide in your email copy. Spam filters scan content first, and certain words or formatting can send your messages straight to the spam folder.
Let’s look at the most common triggers and the deliverability best practices that fix them.
| Spam trigger | Best practice to improve email deliverability |
|---|---|
| Misleading or clickbait subject lines (e.g., “Fwd:” or “Action Required”) | Make each subject line reflect what’s inside and avoid deception |
| Spammy words, phrases, or symbols (e.g., “100% risk-free,” or “$$$$$”) | Clean up your copy; write to the point, without exaggerations |
| ALL CAPS and excessive punctuation (e.g., “LIMITED-TIME OFFER!!!!!!!”) | Use sentence case (in both subject lines and body texts); add no more than one exclamation/question mark in a row |
| Too many links | Drop one link only (ideally a call to action) |
| URL shorteners (e.g., TinyURL or Bit.ly) | Use full URLs to make them transparent |
| Text overloaded with images | Keep your text-to-image ratio 70:30 for email marketing campaigns and 90:10 for cold emails |
| Attached files | Share files as links to Google Drive or Dropbox |
| Broken personalization (e.g., “Hey {{First_Name}}”) | Test your merge tags and set fallback values for empty fields |
| Shared or default tracking domain | Set up a custom tracking domain |
| No way to opt out | For email marketers: Add a one-click unsubscribe link For sales reps sending cold emails: Add a line like, “Not for you? Reply no, and I won’t bother you anymore.” |
Our insights from 10M+ cold emails prove that spam words and attachments drive the highest spikes in bounce rates, nearly doubling them and directly affecting deliverability.


But again, the problem may be closely tied to the ESP itself and its unique spam triggers, which can lower your inbox placement rate.
For example:
Let’s put Gmail under another spotlight in this article. What if your emails don’t go anywhere, not even in the Promotions or any other tab, and just get missing?
Most people only know about Primary, Promotions, and Spam. But did you know there’s a hidden inbox called the Shadow Spam Box? And it’s where the vast majority of emails truly end up — 100 times more than all your other inboxes combined. […] The fix? Custom infrastructure.
CEO of Galadon Gold
Step 6. Set an email deliverability monitoring schedule
A one-off inbox placement test only shows your deliverability at a single moment. But things change fast, so it helps to build a regular monitoring habit. That way you catch problems early, before they pile up and hurt your campaign performance.
How often you check depends on your sending volume and setup:
- Weekly → Best for high-volume email marketing or cold outreach campaigns, or after a major infrastructure shift or recovery from a deliverability problem
- Bi-weekly → Best for moderate email senders on stable infrastructures
- Monthly → Best for low-to-medium sending volumes from long-established domains with a solid track record, and for regular newsletters or promotional emails
- Quarterly → Best for a deep-dive, full email deliverability audit, whatever your volume
Of course, the right approach will vary from case to case. But most cold outreach experts agree that checking before each campaign + monthly is a healthy rule of thumb.
I’d recommend checking your email deliverability before launching every new campaign and at least once every 15–30 days to keep your finger on the pulse. Things change quickly, and deliverability issues can pop up out of nowhere. It’s important to identify and address them as soon as possible.
Email Deliverability Expert at Snov.io

You can also automate some of the monitoring. For example, GlockApps lets you create custom alerts based on specific conditions and sub-conditions, with notifications sent to your email, Slack, or other channels.
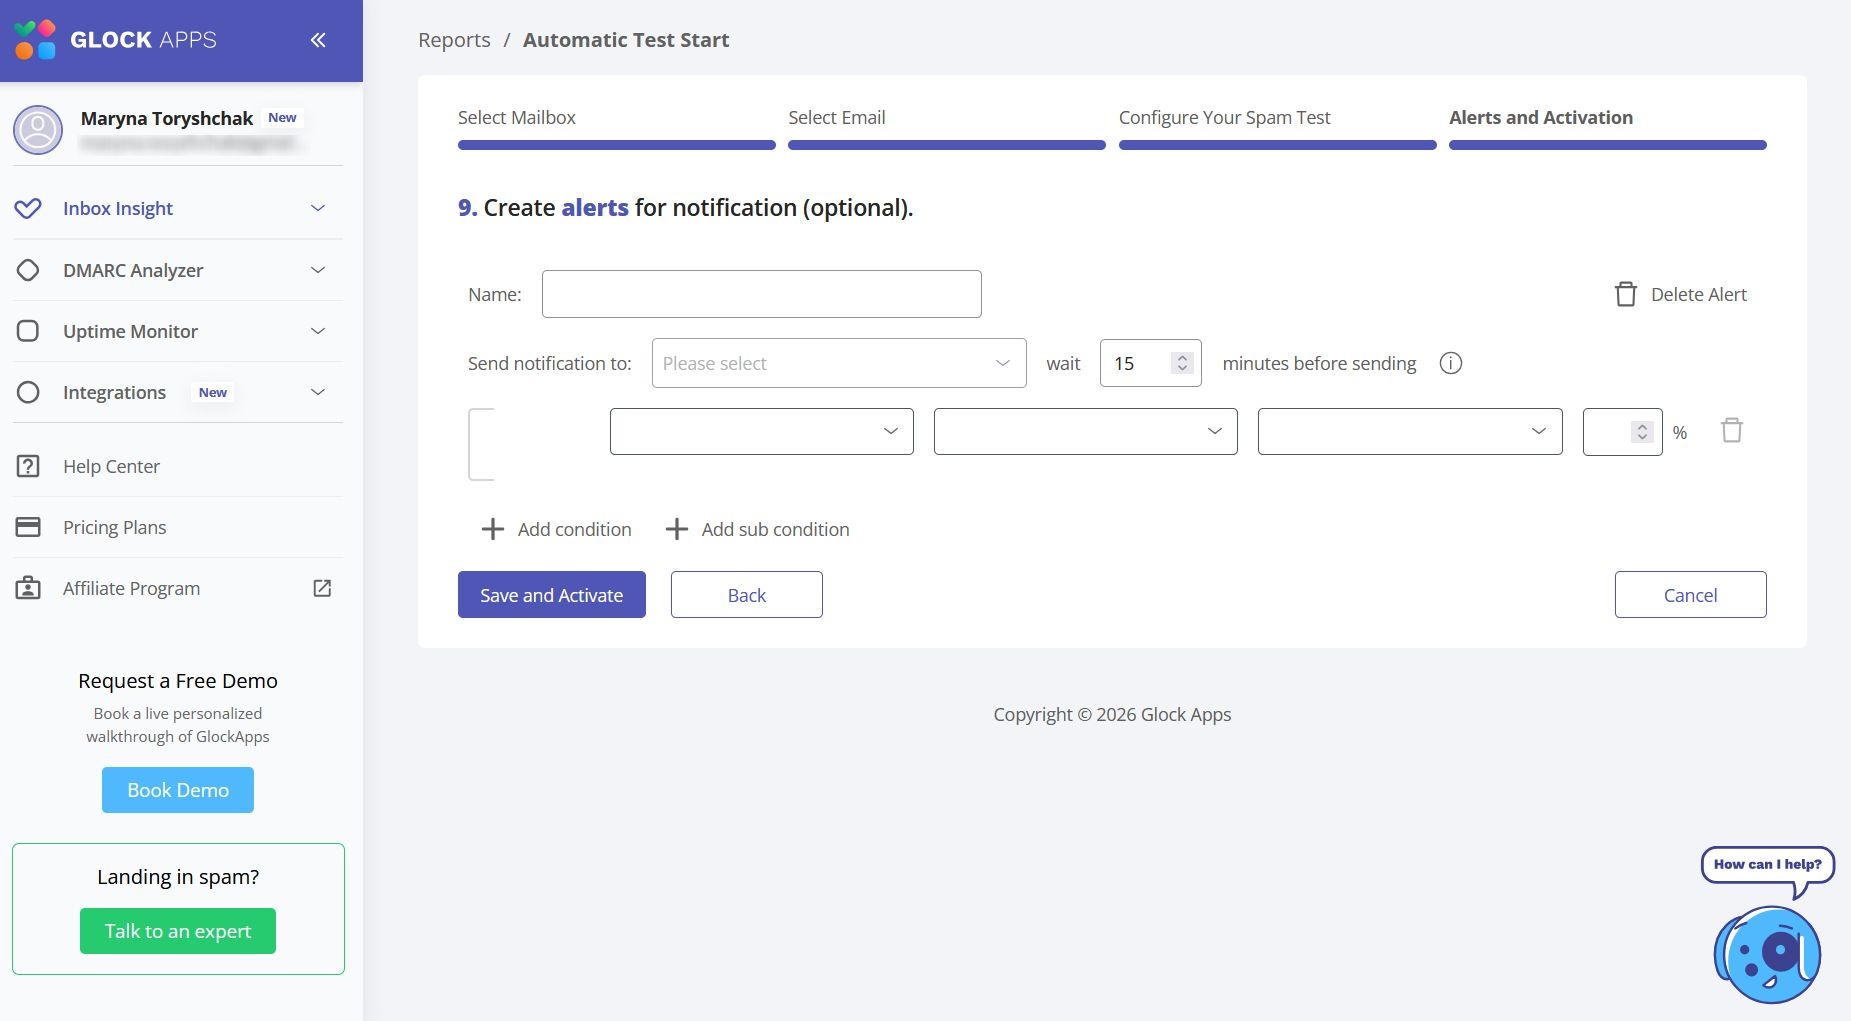
Source: GlockApps.com
🔷Best practice:
Combine it with other email deliverability metrics and set alert thresholds for each, as I’ve demonstrated in the table below.
| Cadence | What to check | Alert threshold |
|---|---|---|
| Weekly | Spam complaints | Spam complaint rate — above 0.1% |
| Bi-weekly | Deliverability by ESP, blacklist status, reply rates | Inbox placement at any provider drops 10+ points; your domain/IP address is blocklisted; reply rate drops 20%+ |
| Monthly | Email authentication (SPF, DKIM, DMARC), hard bounce rates, deliverability by template | Any DKIM, SPF, or DMARC failures; hard-bounce rate — above 1%; for email marketing — monthly newsletter template changes |
| Quarterly | Full audit: Delivery rate, inbox placement, DNS records, sender reputation (IP address + domain reputation scores), soft + hard bounce rates, engagement rates, and so on | Any key metric declining for 2 quarters in a row; overall email bounce rate — above 3% |
Best tools for measuring email deliverability — Quick overview
Here’s a side-by-side comparison of the best email deliverability tools for different needs with prices, unique benefits, and key limitations.
| Tool | Best suited for | Pricing | Unique value | Key limitation(s) |
|---|---|---|---|---|
| Snov.io’s Deliverability Check | Outreach teams that want testing and sending in one place | 1 free check on Trial plan; available in paid plans from $39/mo* | Pairs results with domain health and email content checks, so you can trace both symptoms and causes | Consumes 50 credits per check |
| GMass Inbox Tester | Individual users mass-sending from Gmail | Free inbox tester; paid from $29.95/mo for individuals and $175/mo for 5-user teams | Reports whether a message lands in the Inbox, Promotions tab, Updates, Social, Forums, or Spam folders | Exclusively for Google accounts; only 15 seed addresses |
| GlockApps | B2C email marketing teams | 2 free tests; paid from $85/mo (30 tests included); credit packs starting at $16.99 per 3 tests | Sends to 100+ seed mailboxes and allows setting custom alerts and notifications | Weaker coverage for B2B senders |
| Mail-Tester | Users that need a quick spam score for one message | 3 emails/day for free; paid from $10/mo per 50 tests; one-time from $5 per 10 tests | Free (yet limited) checks without registration | Only one message at a time, no provider-level stats |
| MXToolbox | Teams that manage their own email infrastructure and in-house deliverability specialists | Paid from $129/mo per 30 tests | Free DNS-level checks and blacklist monitoring | Tests only the “Big 3” mailbox providers: Gmail, Microsoft Outlook, and Yahoo Mail |
⚠️ Note: *Numbers may have changed since my last check, so visit the providers’ official websites for current prices.
A practical approach is to pair one of the tools above with a free, provider-specific solution for more detailed insights:
- For Gmail → Google Postmaster Tools
- For Microsoft Outlook → Microsoft SNDS
- For Yahoo Mail → Yahoo Sender Hub
This way, you can see a more nuanced picture with provider-native insights.
Take Google Postmaster Tools. It can help you track delivery errors, analyze spam complaints, and ensure compliance.
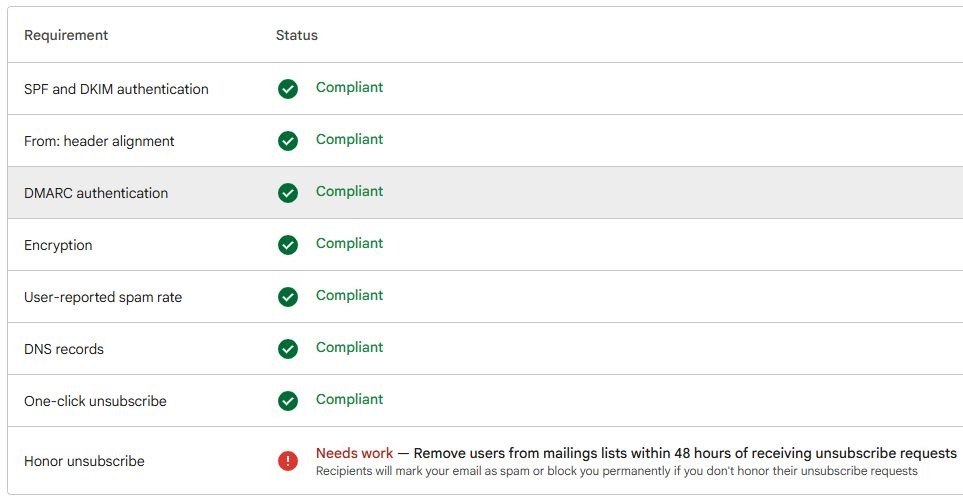
Source: LinkedIn.com
And with Microsoft SNDS, you get a clear understanding of Microsoft’s opinion of your IP address, since it’s strictly IP-based.
What is a good email deliverability rate?
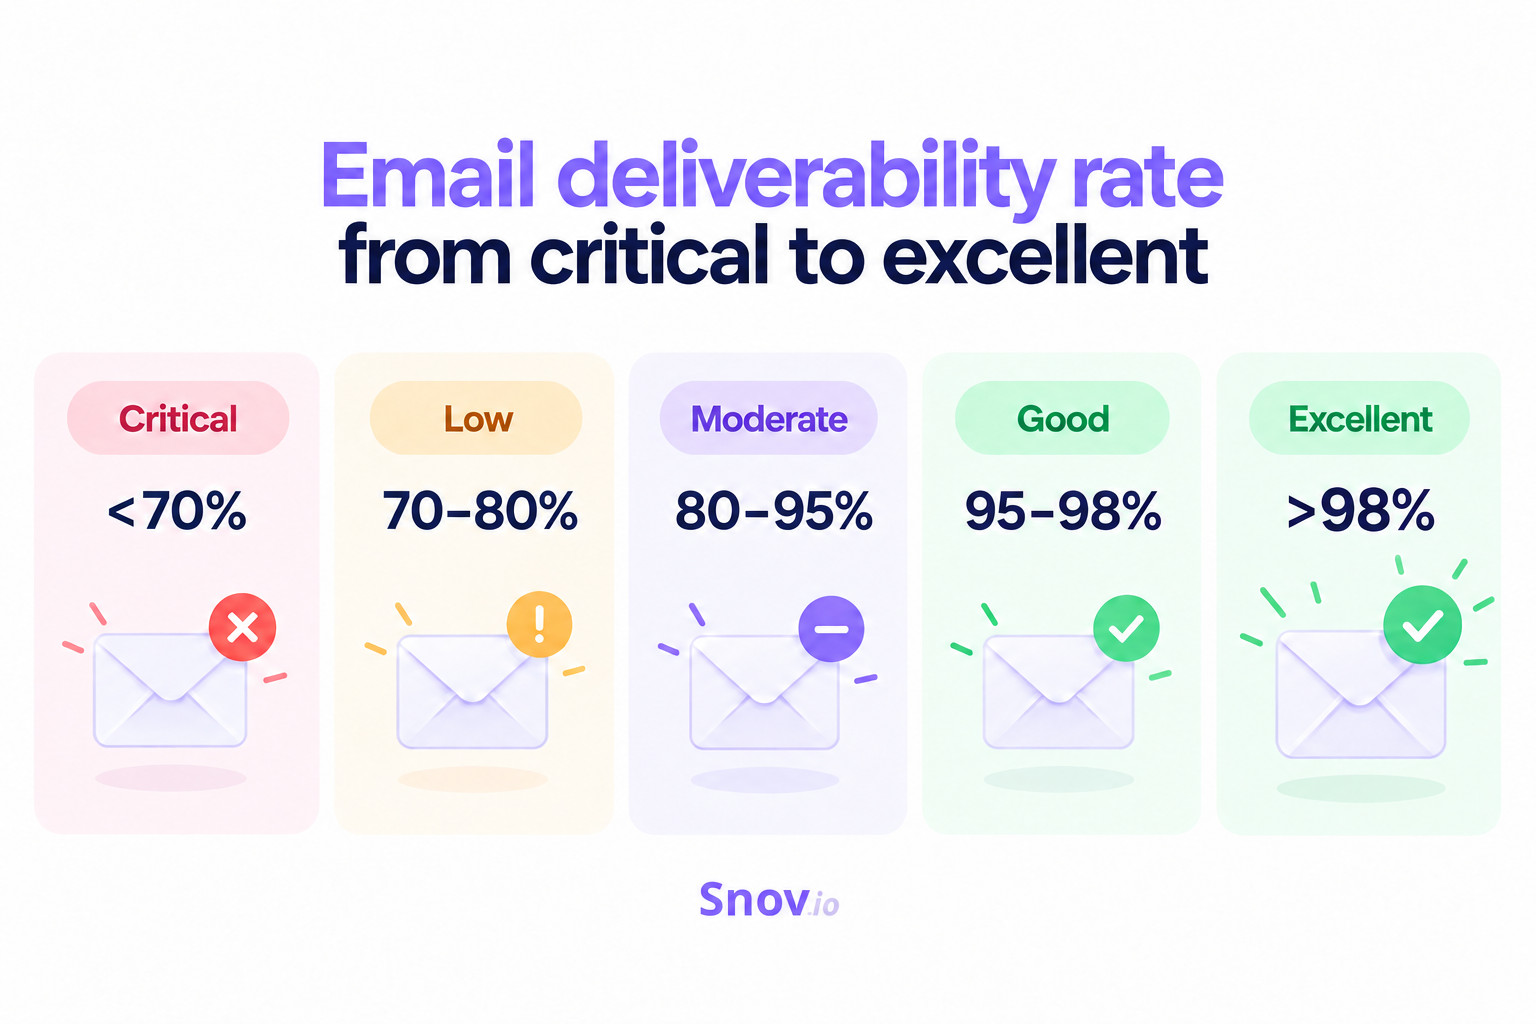
A good inbox placement rate to aim for is around 95–98%. Overall, consult the following benchmarks, going from critical to excellent:
- Critical: <70%
- Low: 70–80%
- Moderate: 80–95%
- Good: 95–98%
- Excellent: >98%
For context, Validity’s 2026 report puts the global average inbox placement rate at 87.2%.
But that number doesn’t tell the whole story. In the next sections, I’ll look at how inbox placement rates differ across mailbox providers and industries.
What are the average inbox placement rates in different mailbox providers?
Among ESPs, Microsoft is the hardest to reach, with the lowest inbox placement rate at 77.4%. Gmail, on the other hand, has the deliverability rate, at nearly 90%.
| Provider | Average email deliverability rate |
|---|---|
| Gmail | 89.8% |
| Yahoo Mail | 87.3% |
| Apple Mail (iCloud) | 82.0% |
| Microsoft | 77.4% |
What are the average inbox placement rates in different industries?
By industry, transportation is the top-performing sector, hitting above 97%, while real estate shows the lowest result — 80.1%.
Check and compare other sectors in the table below:
| Industry | Average email deliverability rate |
|---|---|
| Transportation | 97.2% |
| Telecommunications | 92.6% |
| Retail | 90.4% |
| Manufacturing | 89.9% |
| Education | 87.6% |
| Software | 85.7% |
| Business services | 85.1% |
| Real estate | 80.1% |
Other email deliverability metrics to track: Formulas and healthy thresholds
Now that you’ve measured email deliverability, it’s time to look at other significant metrics that impact it either directly or indirectly.
Copy and save their formulas and healthy benchmarks from the table.
| Metric | What it measures | Formula | Does it impact deliverability directly? | Healthy threshold |
|---|---|---|---|---|
| Spam complaint rate | Share of spam complaints | (Spam complaints ÷ Delivered) × 100 | Yes — the most damaging signal | Below 0.1%, as recommended by mailbox providers like Gmail and Yahoo |
| Hard bounce rate | Share of hard bounces due to permanent failures (e.g., sending to invalid email addresses) | (Hard-bounced ÷ Sent) × 100 | Yes | Below 0.5% |
| Soft bounce rate | Share of soft bounces due to temporary failures (e.g., full mailbox) | (Soft-bounced ÷ Sent) × 100 | Yes, but not as severely as hard bounces | Under 1–2% |
| Sender score | Email-sending IP address reputation | Calculated by Validity on a 0–100 scale from a rolling 30 days of data based on 100+ variables (e.g., infrastructure, spam traps, spam complaints, etc.) | Yes | 80+ is good; 90+ is excellent |
| Domain reputation score | How trustworthy your sending domain is | Proprietary (each provider or tool calculates it differently) | Yes | Depends on the tool, but mostly either “High” or “Good” (e.g., “High” in Google Postmaster Tools) |
| Open rate | Share of those who opened the message | (Unique opens ÷ Delivered) × 100 | No, indirectly only | 20%+ |
| Click rate | Share of those who clicked the link | (Unique clicks ÷ Delivered) × 100 | No, indirectly only | 2–5%+ |
| Reply rate | Share of those who replied | (Replies ÷ Delivered) × 100 | No, indirectly only | For cold outreach: 5%+ For email marketing: 10%+ |
| Unsubscribe (opt-out) rate | Share of those who opted out (unsubscribed) | (Unsubscribes ÷ Delivered) × 100 | No, indirectly only | Below 0.5% per send; ideally around 0.2% |
And now, let’s focus on the trickiest email deliverability metrics, their peculiarities, and solutions for unhealthy results.
Spam complaint rate
Spam complaints can seriously hurt email deliverability. Gmail advises keeping the spam complaint rate below 0.1% and warns against reaching 0.3% or higher.
A complaint occurs when a recipient flags your email as spam or junk using an option such as:
- “Report spam” (Gmail)
- “Move to Junk” (Apple Mail/iCloud)
- “Mark as spam” (Yahoo Mail)
- “Report junk” (Microsoft Outlook)
Cold emails face a higher risk of spam complaints than newsletters. Why? Because let’s be honest — people never agreed (subscribed) to hear from you. So even a small number of those can push you out of the safe zone.
Target people who are likely to find your emails relevant, use a recognizable sender name, and write clear, honest subject lines. Plus, make opting out easy and promptly remove anyone who reports your emails as spam.
Email bounce rate (soft and hard bounces)
Bounces fall into 2 types: temporary and permanent, also known as soft and hard. Together, they constitute the overall email bounce rate = soft-bounced messages + hard-bounced messages. This is the percentage of sent emails that weren’t delivered but returned as a bounce-back.
Healthy bounce rates stay within the 0–2% range, with 5% being a red line. Anything higher gradually harms your sender reputation and inbox placement.
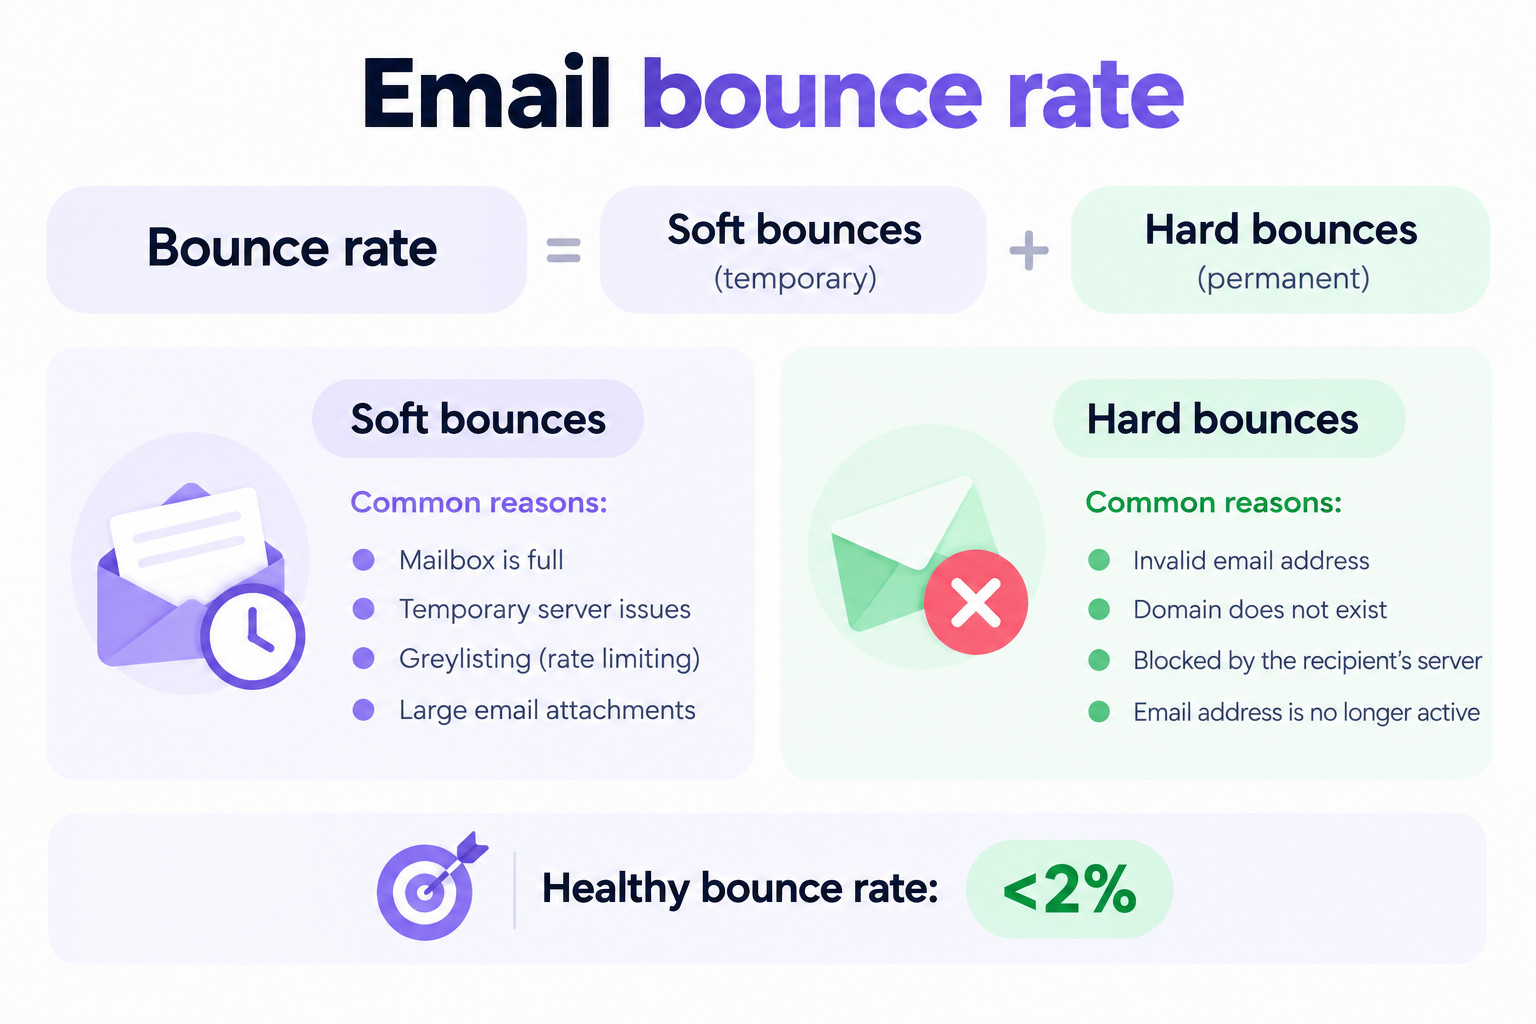
Now, let’s understand why emails bounce and how to fix it: first, the reasons, then the fixes.
| Typical causes of soft bounces | Typical causes of hard bounces |
|---|---|
| The recipient’s inbox is full | The email address doesn’t exist |
| Your message is too large, overloaded with HTML elements or attachments | The domain doesn’t exist or has no mail server set up |
| The receiving server is temporarily down or overloaded | You’re sending to an invalid email address |
| The server temporarily delays messages from unfamiliar email senders | The receiving server permanently blocks you once you trigger its spam filters |
To fix high bounce rates, start by identifying the cause. If bounces point to authentication, policy, or sender reputation issues, review your setup. Use an email verifier before each campaign to remove invalid, inactive, and risky addresses. And stop sending to hard-bounced addresses, monitor recurring soft bounces, and re-validate lists older than 3–6 months.
IP (sender score) and domain reputation scores
Mailbox providers don’t share the full details of how they assess your IP and domain reputation. But you can use reputation scores to get some idea of how they may view your emails:
- Sender score (IP reputation): It isn’t a commonly tracked metric by email deliverability tools. Sender Score is a proprietary tool by Validity that rates you on a scale from 0 to 100 to show how reputable your IP appears (0 is the poorest; 100 is the best reputation).
- Domain reputation score: This score assesses your email sending domain and sticks to you no matter which IP address or platform you send emails from.
The lower your reputation, the lower your deliverability rate. With a shared IP, you also share the risks: if spam bots or other users engage in abusive behavior, your sender reputation can suffer, too.
Also note that earlier, you could access Gmail’s estimates directly via Google Postmaster Tools. But in 2025, Google removed the Domain Reputation and IP Reputation dashboards. So, to measure both, consider tools like Cisco Talos Intelligence, IPVoid, or others.
Consider using a dedicated IP address instead of a shared one, and make sure your sending domain is authenticated with SPF, DKIM, and DMARC. Resolve any blacklist issues and perform an email warm-up, especially for new domains and mailboxes without an established reputation.


Engagement rates: Opens, clicks, replies, and opt-outs
Engagement metrics can help you assess email deliverability, but not all of them are equally reliable. Here’s what each one can tell you and where its limitations lie.
| Engagement rates | Can you fully rely on them? | Here’s why |
|---|---|---|
| Open rates | ❌No, only partially | Some privacy-centric ESPs (e.g., Fastmail or Proton Mail) block open tracking altogether. Others inflate them. For instance, Apple Mail Privacy Protection automatically loads tracking pixels. It counts as an open, even when nobody actually opened it. |
| Click rates | ❌No, only partially | Clicks seem more meaningful than opens because they require action. However, some spam filters scan links automatically. This may produce fake clicks. |
| Reply rates | ✅Yes (particularly in cold outreach) | Recipients’ responses are a signal for mailbox providers that they want your messages. The higher your reply rate, the stronger the reputation, the better inbox placement. |
| Unsubscribe rates | ✅Yes (particularly in email marketing) | A skyrocketing unsubscribe rate means that you’ve missed the mark (e.g., your targeting is too broad or your content is too salesy). Unsubscribes are less harmful than spam complaints, though, given that people have a clear way to opt out (one-click unsubscribe link). |
So, response rates are the most reliable metrics for cold emails and unsubscribe rates — for email marketing campaigns. Open rates and click rates are the least dependable. Let alone that our analysis of 44M+ emails showed that open tracking cuts reply rates more than in half — 2.36% vs only 1.08% with tracked opens.
Start by revisiting your targeting so that each contact matches your ideal customer profile (ICP). Then:
- Personalize your copy beyond the first name (e.g., mention something ultra-specific about them, such as a recent conference speech or a new funding round)
- Shorten your messages (ideally — under 10 seconds to read for cold emails)
- Make images, links, or other elements useful for your ICP(s), not just for the sake of sharing them
Finally, don’t forget to A/B test various elements of your copy to see what works and what backfires.
Key takeaways
To round it up in a concise instruction, here’s how to measure email deliverability step by step:
- Verify your email authentication protocols (DNS records: SPF, DKIM, DMARC): A misconfiguration makes your results unreliable
- Check for blacklisting: Confirm your IP and sending domain aren’t on public blocklists
- Run a seed-list inbox placement test: Remember a healthy benchmark — 95% or higher
- Break the results down: Segment them by mailbox provider, campaign type, email template, sending domain, and contact list source
- Find issues and implement relevant fixes: Start with your email content, since it’s the most common root cause of deliverability failures
- Regularly monitor the most critical email deliverability metrics such as spam complaints, bounces, and sender reputation.
- Set up alerts for engagement metrics (opens, clicks, replies, and unsubscribes), since they also shape your sender reputation and, therefore, your deliverability rate.
To start measuring, use tools like Snov.io’s Deliverability Check, which can perform an automatic test with no manual hassle.