In this guide, you'll learn how to review and analyze the campaign metrics that determine the success rate of your campaigns. By doing so, you can and identify where your cold email automation succeeds and where it needs improvement.
On the Campaigns page, you'll find a summary of all campaigns in your account, their current status and progress. This summary includes key metrics and general campaign details for quick review.
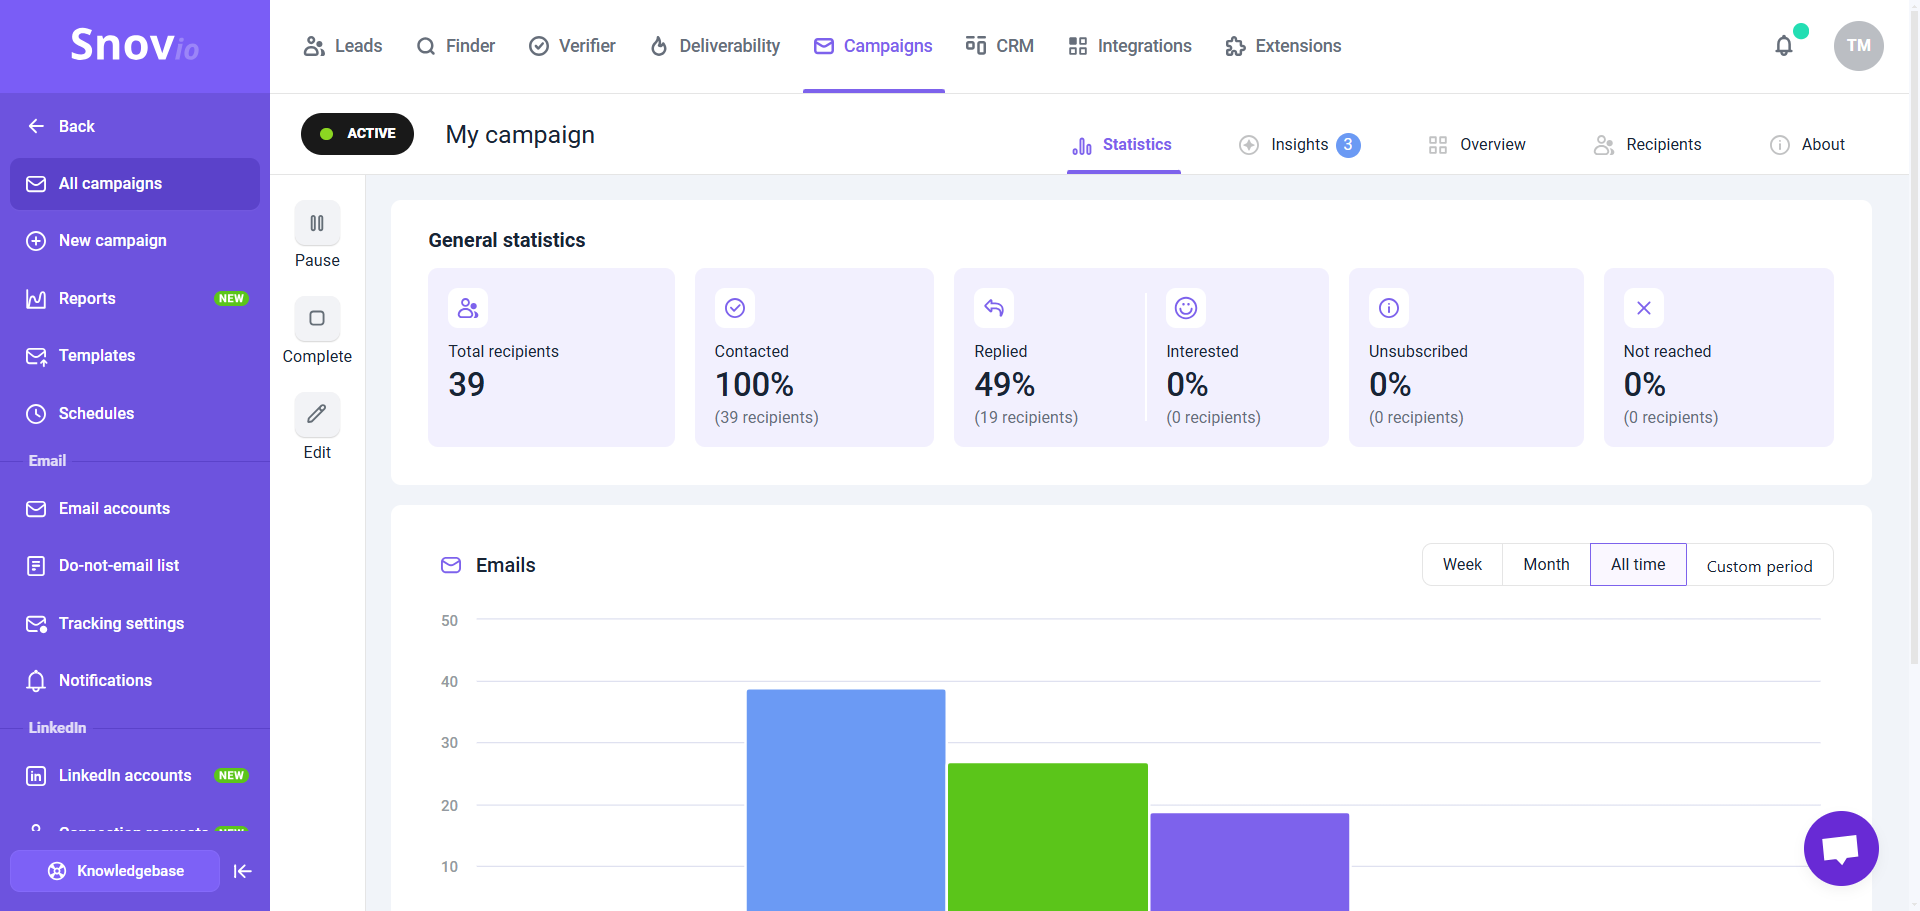
Each campaign has its own Statistics dashboard. Click on the campaign from the list to open it.
After you launch multiple campaigns, use the Reports dashboard for broader analytics. Check detailed metrics and results across all campaigns and sender accounts.
Which metrics to monitor
Don’t let a bad campaign keep sending. If you see the signs of trouble, pause it until you make adjustments. If current limits aren’t bringing results, increasing volume will only hurt your sender reputation.
Bounce rate
Bounce rate is one of the clearest signals of list health. Even a small number of bounces can hurt your sender reputation.
Aim for a bounce rate of 5% or lower. To reduce bounces:
- Verify your email list before every campaign and check list health using our guide
- Add bounced contacts to your Do-not-contact list
Open rate
Open tracking can be distorted by bots and spam filters, so use open rate as a secondary signal, not your primary KPI.
| Open rate | What it means |
|---|---|
| 50–70% | This is a good range. Even if some opens are from bots, it means a big part of prospects see and read your emails.
Keep your settings as they are and scale up gradually. |
| 30–50% | This result means your setup could use some optimization. Don’t increase sending limits yet.
Try these steps to troubleshoot:
|
| 10–20% | This points to serious issues with spam. Your emails may not be reaching prospects. Most of these opens are likely coming from bots.
Don’t add more prospects to this campaign until you change your settings. Ensure this:
|
Reply rate
Reply rate is the better indicator of relevance. It shows how well your offer/email works for the chosen ICP.
Reply rate is your main signal for when to scale a campaign or when to change it. Every reply, positive or negative, is a data point you can use to your advantage.
6-8% reply rate: Strong result. Your ICP is well-defined and your value clearly resonates with prospects.
3-5% reply rate: That’s a solid cold outreach result. You can scale, but do it gradually.
1-2% reply rate: That’s a sign the campaign needs optimization. Do not increase volume to fix it.
If your reply rate falls below 2-3%, don't add more prospects right away.
What to do at this step:
Work through this in order:
- Run a deliverability check before editing your copy
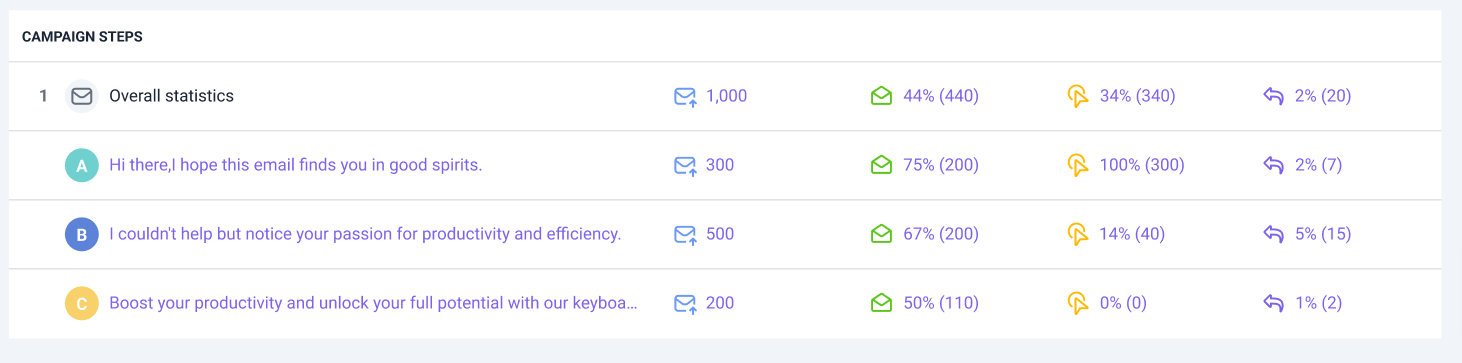
- Check performance by sequence step in campaign statistics
Is the reply rate low across all emails in the sequence, or just one step? If it's the first email, the problem is your subject line or opening.
If it’s the follow-ups, the problem may be your offer angle or CTA.
- Use A/B tests where you change one variable at a time (test a single element) The highest-impact things to test first, in order: subject line → opening sentence → CTA phrasing → offer angle
- Check your ICP. If deliverability is healthy and copy is solid, the segment is wrong. Use AI ICP Generator to identify similar segments, then collect a fresh list of 50–100 prospects from Database Search
Total recipients:
Indicates the size of the campaign: the overall number of recipients added to this campaign from your prospect list based on campaign settings.
Contacted:
Indicates the progress of this campaign: the percentage and number of recipients who have received at least one email from the sequence.
Replied:
The percentage and the number of recipients who replied to at least one email in this campaign.
Interested:
The percentage and number of recipients whose replies were marked as "Interested". Learn more about sentiment analysis.
You can assign interest levels to recipients in campaigns or prospects in the prospect lists manually. To do this, click on the prospect's name in the list to open their profile, find their reply in the Recent Activity, and select the emoji that matches prospect's mood.
To enable automatic reply analysis with AI, upgrade to the Pro 5K plan or higher.
Unsubscribed:
The percentage and number of recipients who clicked the unsubscribe link in one of your emails.
A high unsubscribe rate (above 1-2%) could mean your offer is irrelevant to those prospects. Improve your lead targeting and add delays between follow-ups.
Not reached:
This metric shows the percentage and number of recipients who couldn’t be contacted in the campaign. In email campaigns, this happens when an email bounces or receives an auto-reply.
Statistics per time period
The chart at the center visually displays recipient actions over time. Each colored bar represents a specific metric: sent, opened, clicked, replied, or bounced.
On the right side, choose a timeframe for displaying metrics: Week, Month, All time, or Custom period. By default, it's set to All time.
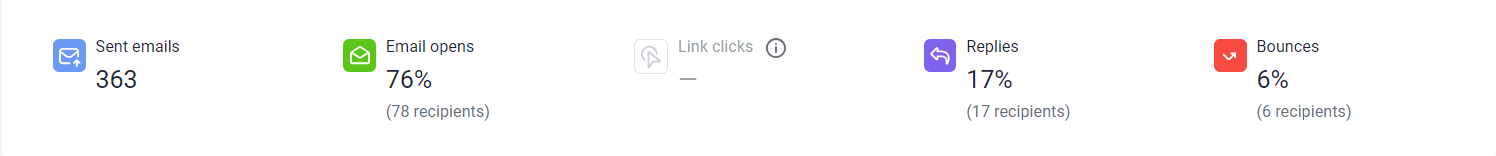
Sent emails:
This indicates the total number of emails sent to recipients in this campaign. This metric includes all emails from the sequence.
Email opens:
This is the percentage of recipients in the campaign who opened at least one email from the sequence. It helps to know if your subject line and email content are effective. Low open rate (below 20%) signals possible issues with deliverability or that your subject line needs to be improved.
Link clicks:
This metric measures the percentage of recipients who clicked on a link within your emails. It can help you evaluate the effectiveness of your call-to-action (CTA).
Replies:
This metric tracks the percentage of recipients who have replied at least once to any email in the sequence. A low reply rate (below 2-3%) suggests there may be issues with your email content or the relevance of your offer. Learn best practices to get more replies.
Bounces:
This metric tracks the percentage of emails that could not be delivered to the recipient's inbox. High bounce rates (above 10%) can indicate issues with your email list. Here's the checklist to prevent high number of bounces.
Statistics per sequence step
If you have a question that we haven't covered, feel free to reach out to our Customer Care team. You can contact us at help@snov.io or through live chat. We're here to assist you!

Sorry about that 😢
How can we improve it?