TL;DR:
We analyzed more than 44 million emails and combed through 20+ pieces of external research to discover the main email marketing trends of 2025. Here’s a sneak peek:
- An average of 361.6 billion emails is sent and received daily.
- Email marketing ROI is $10-$50 for each dollar spent.
- Turning off open tracking results in 2x higher reply rates.
- Automated campaigns demonstrate 2,361% higher conversion rates than traditional campaigns.
- AI-driven hyperpersonalization is the number-one trend.
But that’s barely scratching the surface. Read this article to discover other significant insights that will help you shape a winning email marketing strategy for 2026.
Marketing guides are often based on the author’s subjective opinion or out-of-date information. At Snov.io, we prefer facts, so we rely only on the most recent primary data.
All information in this article comes either from our own research or from reputable sources, which I carefully double-checked. You can consult the full list of citations at the end of this report.
Outline:
- Is email marketing overrated?
- How does email compare to other marketing channels in 2025?
- How often and when to send emails
- Email automation: a deliverability and conversion booster
- Segmentation and personalization statistics
- Subject line, body, and signature in email marketing
- Does visual content in email campaigns boost engagement?
- Desktop and mobile optimization statistics
- 2025 and beyond: trends and forecasts
Is email marketing overrated?
Email is being questioned as an effective marketing channel every coming year. And yet the numbers show that it is stronger than ever. Let’s see how statistics answer the following common questions:
How many email users are there?
In 2024, an average of 361.6 billion emails are sent and received per day – a 4.1% increase from the previous year. It’s forecasted to grow further by a similar margin in 2026, hitting 408.2 billion.
What is the average ROI in email marketing?
Speaking of conversions, email is still the top-performing channel for most companies. The return on investment (ROI) businesses get from email marketing remains unmatched, usually from $10 to $50 per $1 spent.
What is the average email open rate?
In 2024, the average open rate was 26.6%. Keep in mind that these metrics differ slightly depending on the industry as well as the region you’re in.
What is the average email reply rate?
The average reply rate is dipping to 5.8%, though you may double it if you turn off open tracking. A significant difference, isn’t it? That’s because a reply is how you get to a conversation and conversion.
What is the average email CTR and CVR?
Although the ROI remains high, click rates (CTR) went down to 1.22% worldwide last year, while click-to-conversion rates (CVR) grew to 5.88%. This means that prospects are less likely to click on a message, but once they do, they are more likely to buy.
What is an average email bounce and unsubscribe rate?
It’s also crucial to review your campaigns’ bounce and unsubscribe rates. Then explore how they compare to industry-wide benchmarks. A year ago, the average unsubscribe rate across industries was around 0.22%, while bounce rates reached 2.33%.
Key takeaways:
- Email use is growing steadily, with billions of messages sent daily. As its ROI remains unbeatable, it’s reasonable to continue investing in email marketing.
- Focus more on boosting reply rates. As an option, you may experiment with turning off open tracking.
- As email click rates are dropping, while the average CTR is rising, prioritize quality content and strong CTAs over email volume.
- Regularly monitor bounce and unsubscribe rates and use benchmarks to keep deliverability and sender reputation high.
Not meeting the above benchmarks?
Maybe your messages aren’t reaching the right audience or aren’t landing in inboxes.
To make sure your campaigns reach your prospects, start with verified contact data. Use the Email Finder tool to discover and validate accurate email addresses. This is the easiest way to build a high-quality list that drives engagement and conversions.
How does email compare to other marketing channels in 2025?
Statistics prove that email marketing plays a pivotal role in customer-seller communication. Let’s dive deeper.
What is the state of email marketing in 2025
About 73% of the buyers prefer hearing from sellers via email. For context, a phone call is preferred by only 49% of consumers.
Last year, 50% of customers made a purchase from an email, compared to 48% for social media ads, 43% for social media posts, 24% for SMS, and 21% for digital display ads.
Not a surprise, 87% of marketing leaders consider email marketing critical to their success. About 65% of surveyed professionals use it most often, followed by social media and video content.
For small businesses, things are a bit different. Marketers view social media as a slightly better opportunity to obtain new customers.
When asked about the easiest-to-use channels, most respondents also name email as well as Facebook. Other social media channels appear to pose more challenges.
Thus, email marketing seems to be the perfect combination of usage simplicity and effectiveness.
Which type of email is most effective?
To convert prospects, business professionals rely mostly on:
- marketing or promotional messages (55%),
- newsletters (46%),
- lifecycle or onboarding messages (44%), and
- action-triggered messages (39%).
Take a look at this breakdown:
But what do recipients really want to read? Turns out, the RSS messages drive the most engagement. They yield a 10.57% click rate and an 18.63% click-to-open rate.
What is RSS?
RSS is an abbreviation for Really Simple Syndication, which, in the context of messaging, means a method that allows users to sign up for blog updates or a company newsletter.
What are the key email marketing goals?
By leveraging a different mix of messages, marketers are aiming to achieve three main goals:
- Improve customer retention (39%)
- Boost sales and revenue (41%)
- Generate MQLs and conversions (40%)
- Analyze customer engagement (59%).
Key takeaways:
- Email marketing isn’t dead in 2025. Neither will it be in 2026. Email outperforms other channels in preference and conversions. It is cheaper and easier to use, which makes it effective, especially for small businesses.
- Don’t limit your marketing strategy to promos only. Mix in newsletters and triggered messages for higher engagement.
And remember that social media networks are gaining more and more popularity these days. It makes sense to combine email with these messaging channels for higher engagement and conversions.
How often and when to send emails
It might seem that in order to reach such ambitious goals, marketers need to send a lot of messages. And it’s true, an average team sends around 15 emails every month. At any given time, 23% of teams have up to five drafts in production.
But how does it sit with customers? Well, numbers tell us they are ready to receive 1-2 newsletters per week. More than that can be perceived as spam.
It also matters when you send your campaigns. Stats show that the first hour after you’ve hit “send” is when most recipients will engage with your message. The whopping 21.20% of opens and 44.14% of clicks happen during this time.
How many follow-ups should you send?
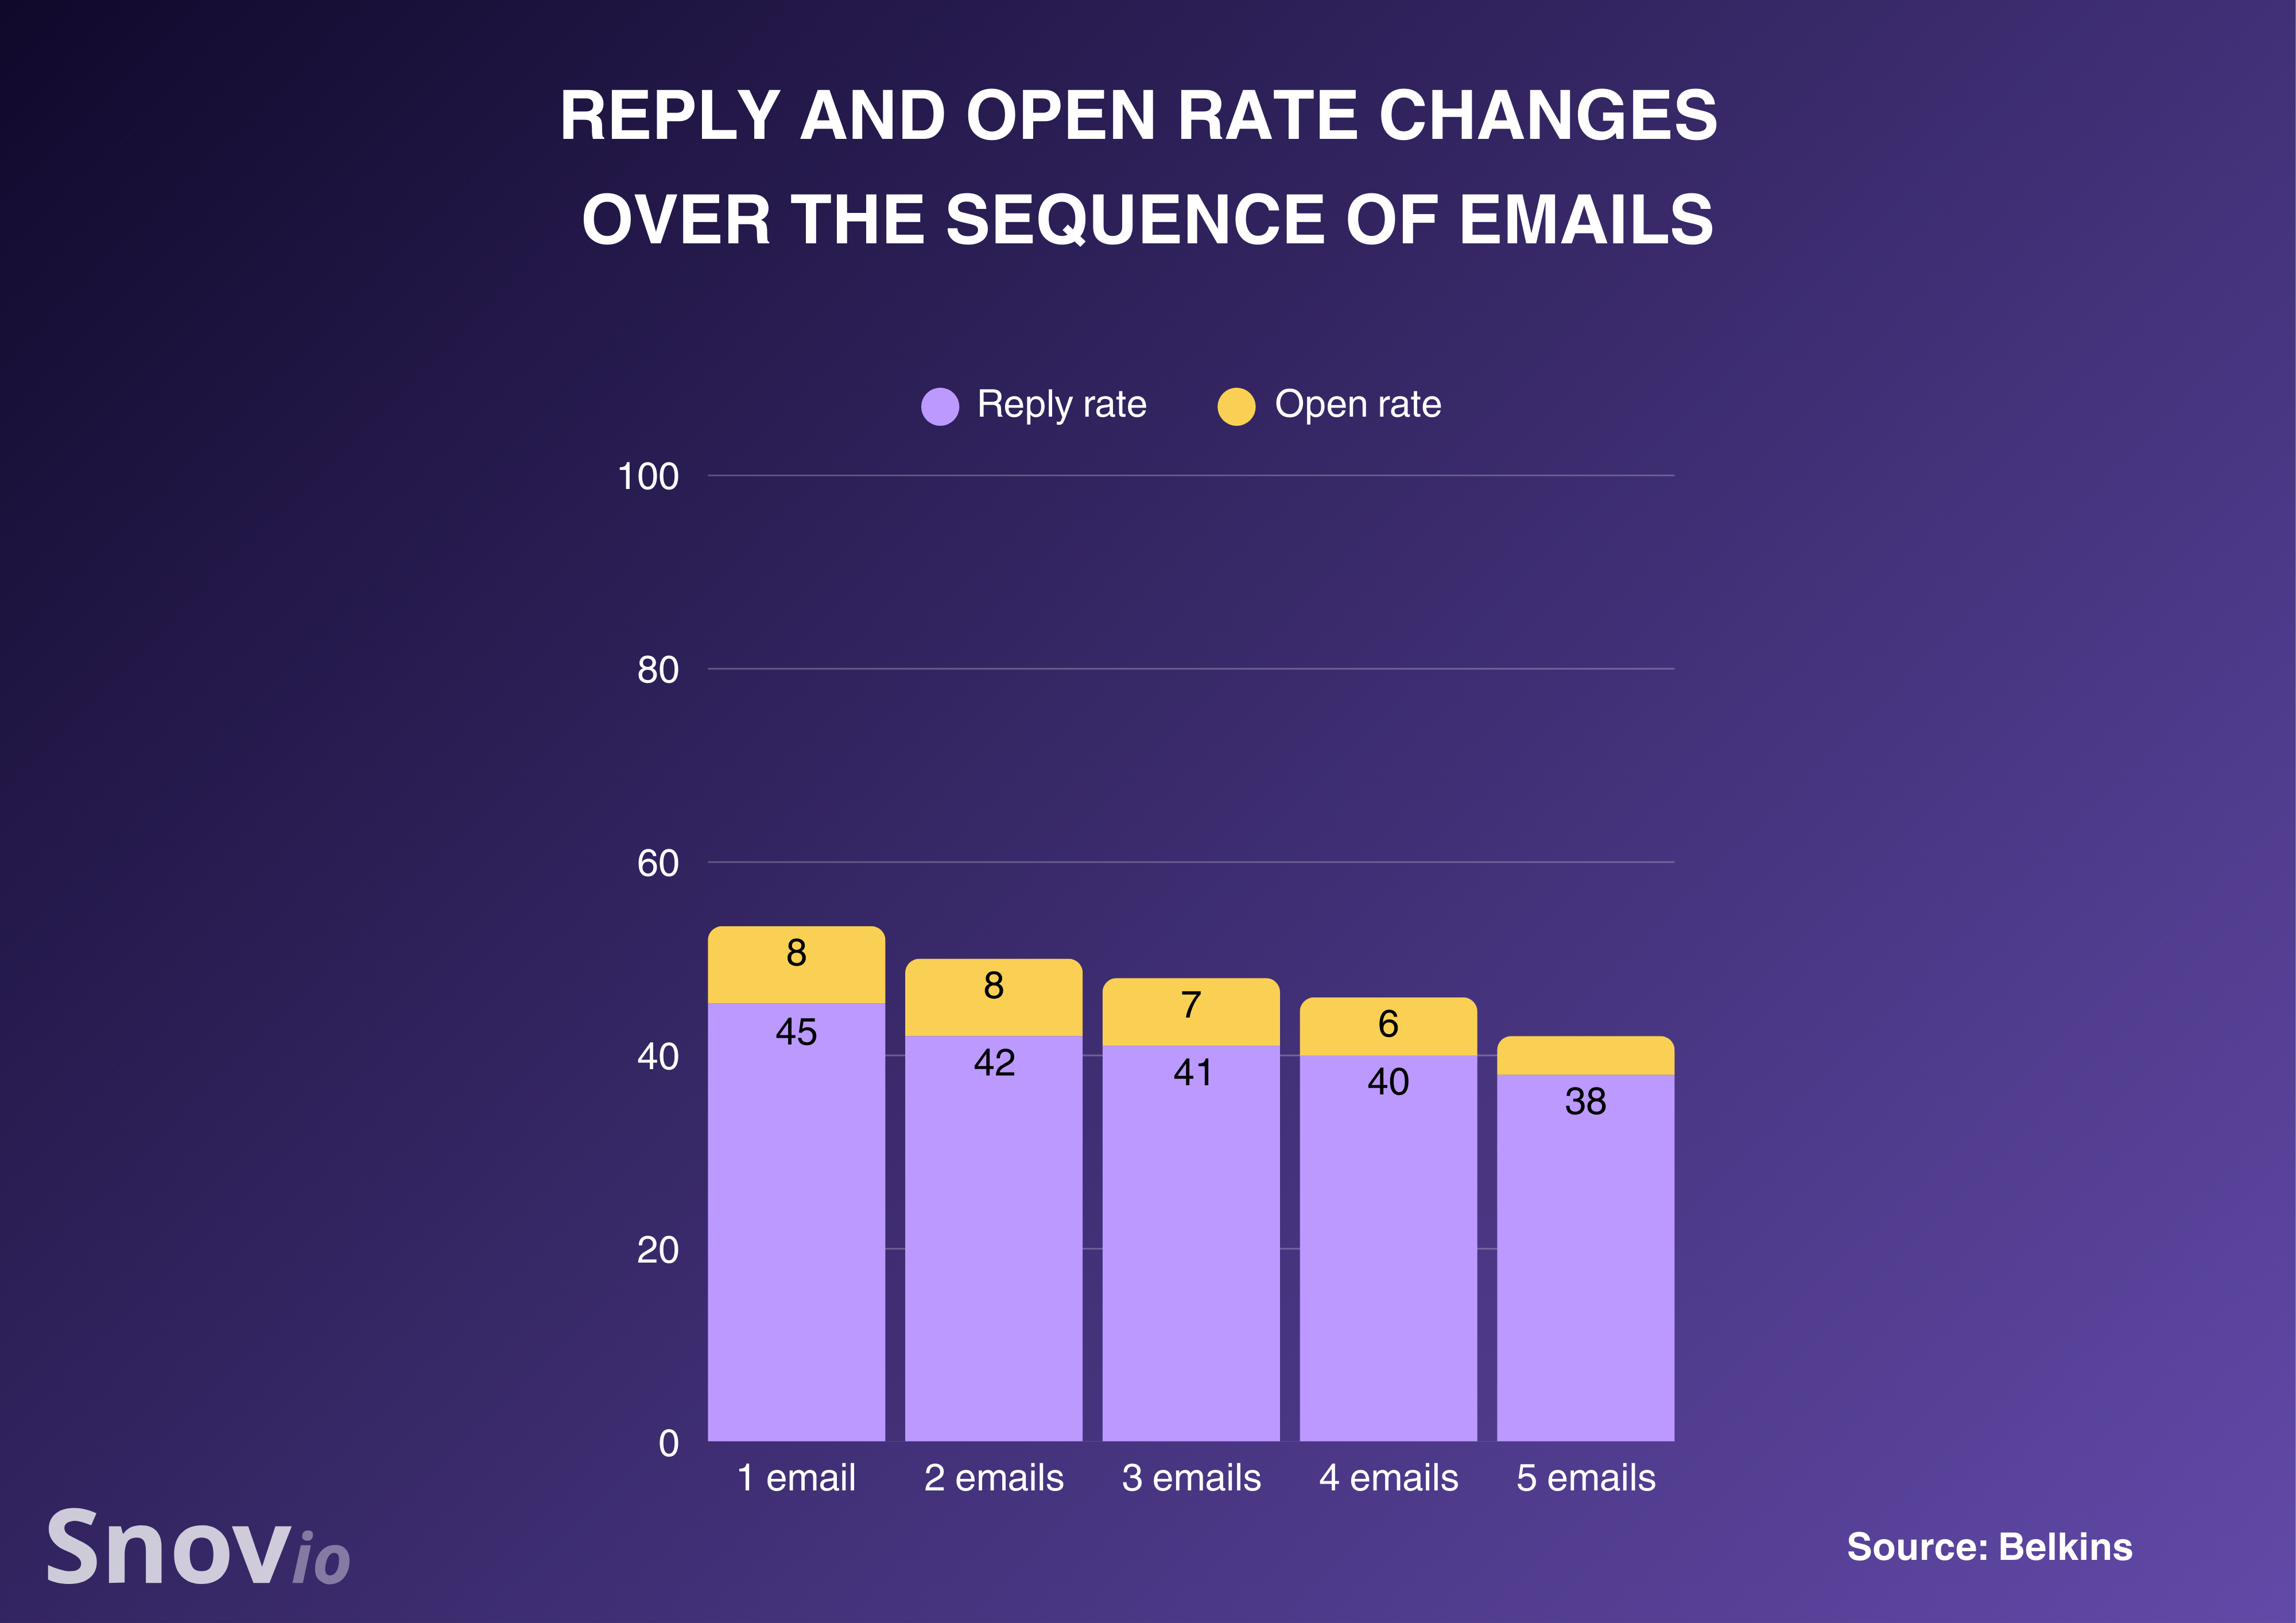
If we’re talking about cold outreach, a sequence containing just one follow-up outperforms the longer sequences. After the third follow-up, reply rates drop and unsubscribe rates go up drastically – up to 2%.
When is the best time to send emails?
Send campaigns when recipients are most active in order to drive results. The exact timing depends on your target audience and your goals – whether you’re looking to boost opens, clicks, or replies.
To get more replies, send your campaign on Thursday as this day looks most converting (6.87%). Tuesday and Wednesday are good enough too, while Monday, Friday, and weekends are the worst days for the outreach — the average reply rate on these days is around 5.4%.
Morning hours (8 am – 12 pm) and those after lunch (5 pm – 11 pm) work best, boasting an average of 6.07% reply rate.
What time of the year is best for email marketing?
Holiday season, and especially Black Friday, is the time shoppers want to start receiving communication from companies in their inboxes. 35% of customers want to start hearing from brands a full month before BFCM, while 21.9% want their interaction to start even earlier.
Don’t miss the chance to connect with your prospects when they are most likely to read their correspondence, as click rates rise to 13% on Black Friday and 11% on Cyber Monday. Pretty impressive, compared to the usual 1.22%!
Key takeaways:
- Don’t send more than two emails per week; otherwise, you may be perceived as a spammer.
- Following up is a must for cold outreach, but you should be smart not to face follow-up fatigue after the third message.
- Schedule your campaigns for Tuesday-Thursday, aiming at morning or post-lunch hours. Avoid sending campaigns on the weekend. And don’t forget to experiment with timing – no one knows your audience as well as you do, after all.
- Black Friday is a high season for email marketers. Prepare for it beforehand, working out an effective strategy that could boost engagement, conversions, and sales.
Looking for proven ways to win leads over during Cyber Week? Read real-life stories and get actionable advice from the Snov.io experts:
Email automation: a deliverability and conversion booster
As I’ve already mentioned, automated messages account for the highest ROI. Let’s see what numbers say about the importance of automation for email marketing in 2025 and 2026.
How can automation improve customer engagement?
Compared to regular scheduled campaigns, automated sequences bring:
- 52% more open rates
- 332% more click rates
- 2361% higher conversion rates.
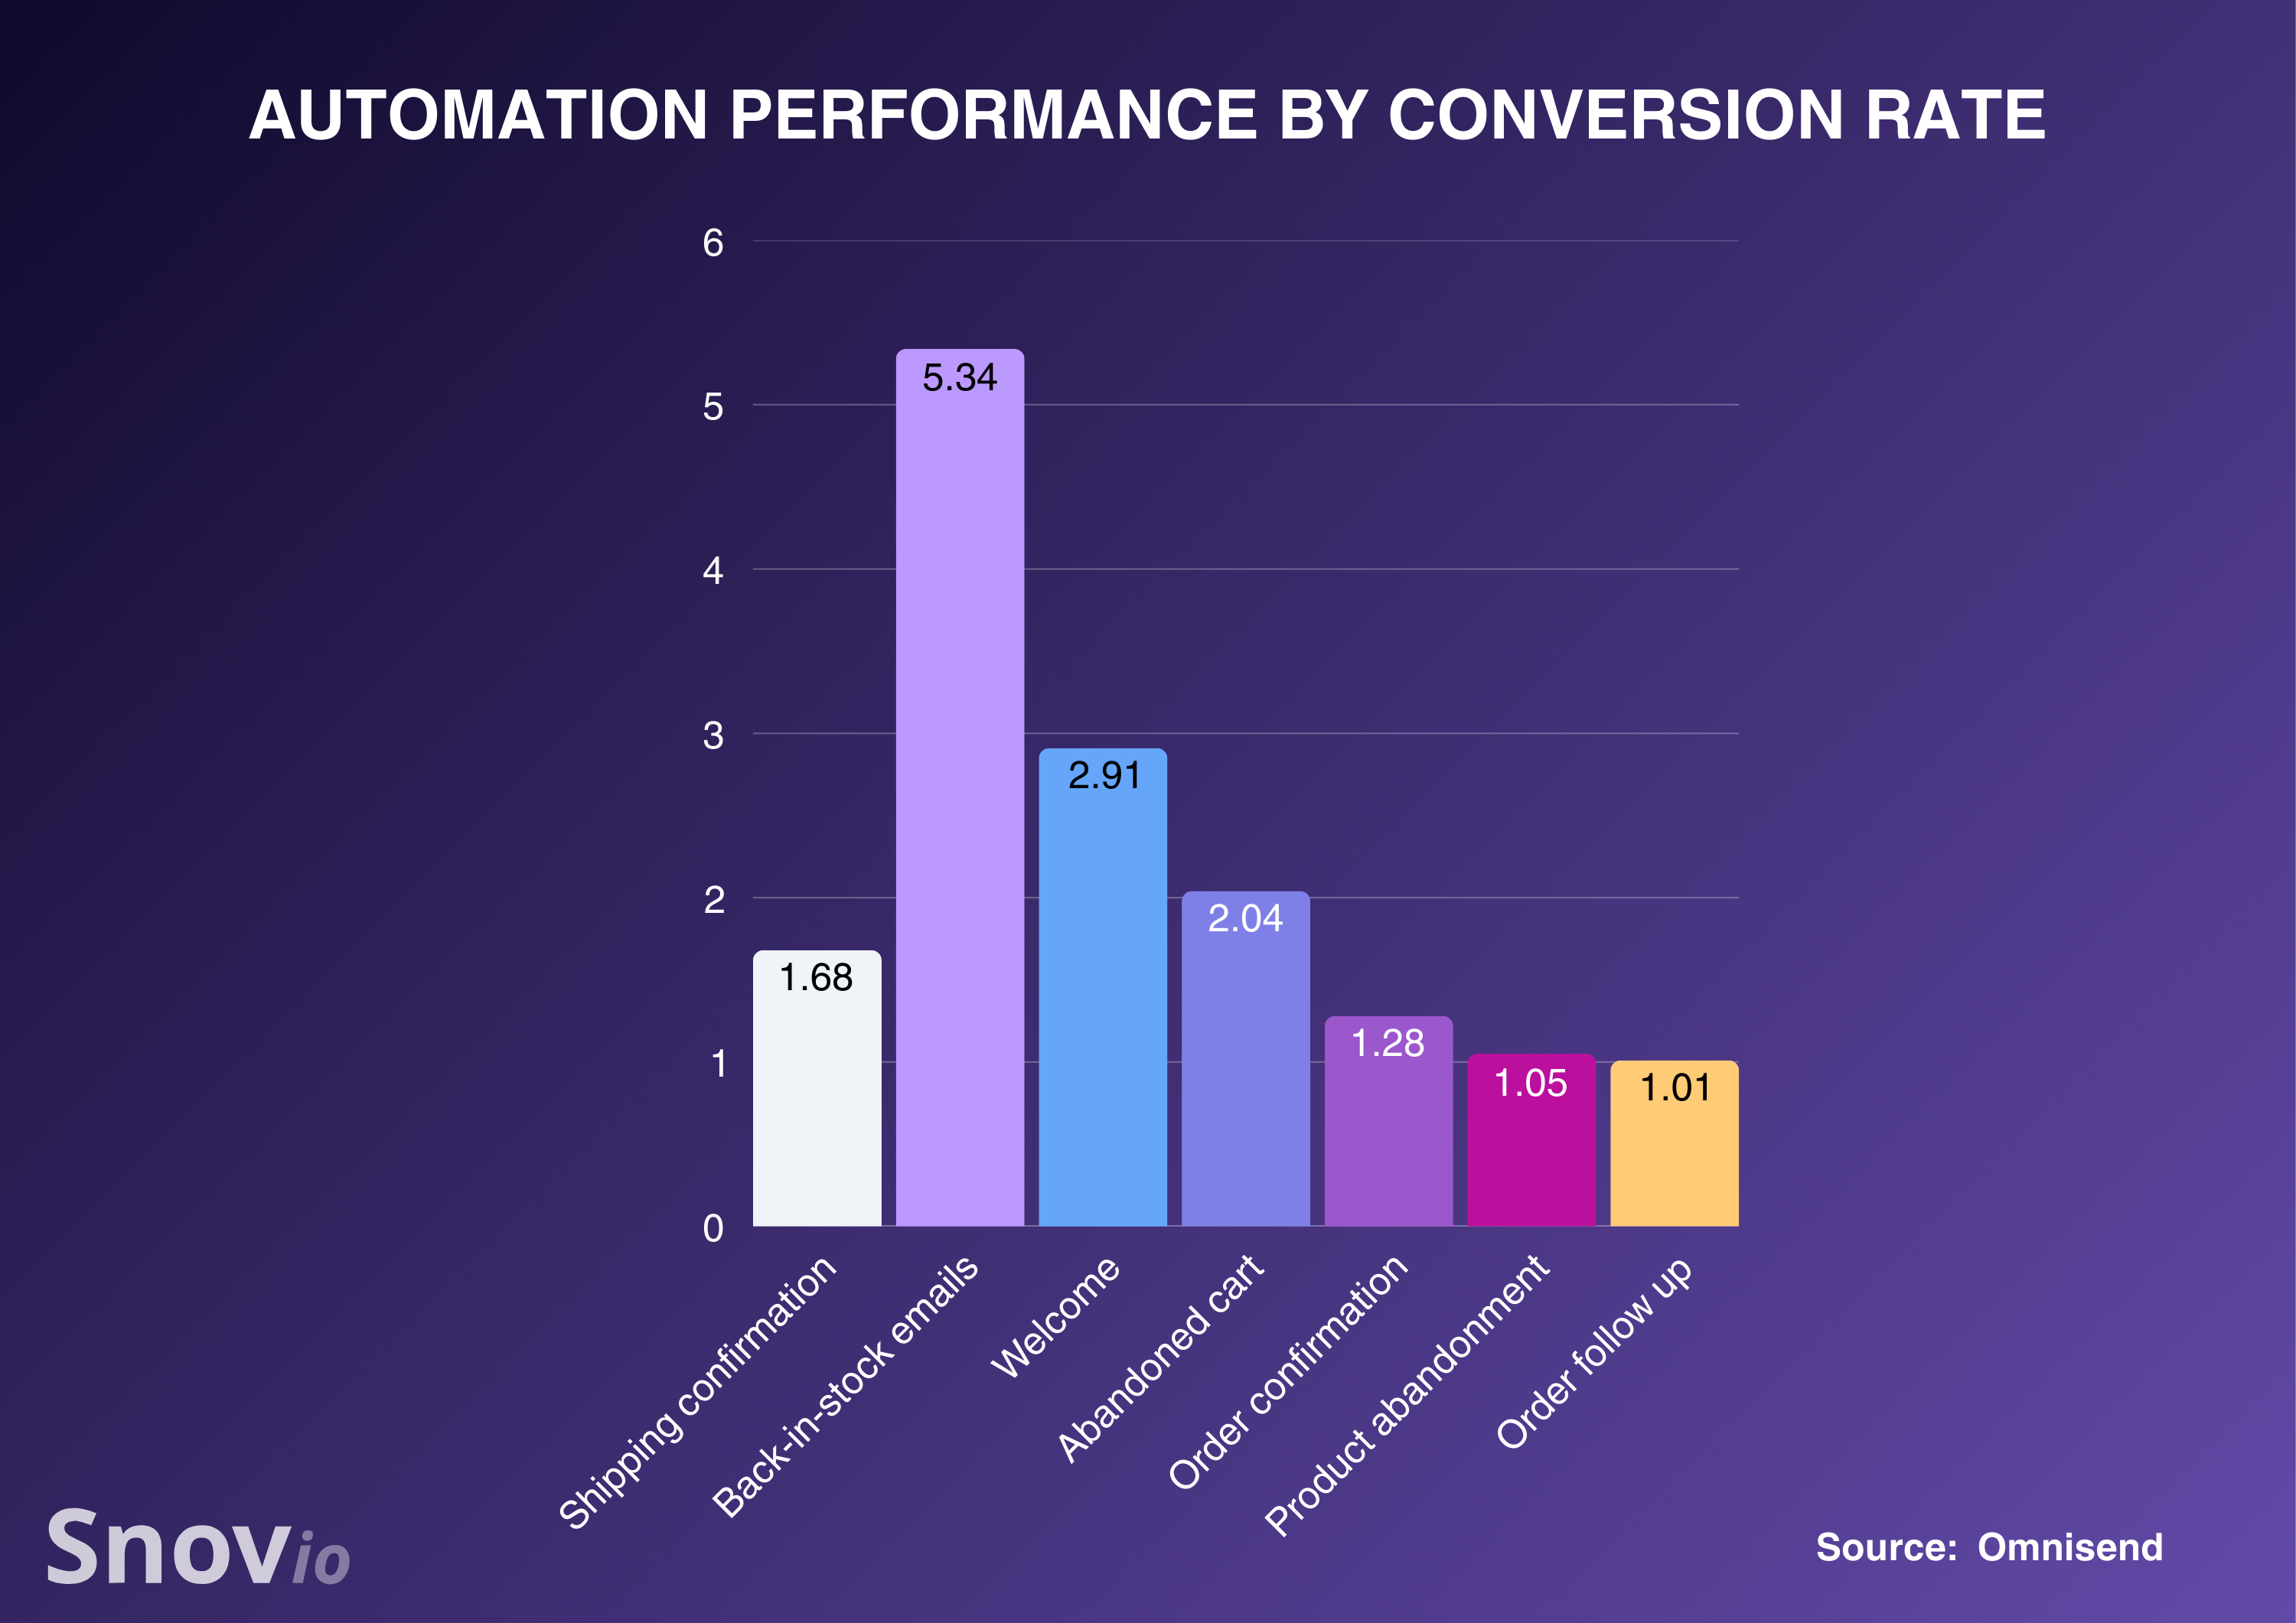
Yes, an astounding 2,361% better conversion rates! The champions among them are back-in-stock, welcome, and abandoned cart messages.
Last year, for instance, 1 in 3 people who clicked on the automated email ended up buying.
What are the email automation challenges?
Although email automation is an effective tactic, it still poses certain problems to marketers, the key ones being:
- ensuring deliverability and avoiding spam filters (48%),
- creating engaging content (45%), and
- maintaining subscriber engagement over time (45%).
To overcome these challenges, focus on list hygiene, personalized content, and regular A/B testing to keep deliverability high.
What will be the main email automation trends in 2026?
The future of marketing automation will be tightly connected with AI. Statistics prove it: among the most impactful email automation trends are:
- AI-driven hyperpersonalization (39%),
- more focus on accessibility and inclusivity (31%),
- advanced predictive analytics for smarter targeting (31%), and
- integration with other communication channels, like chatbots, or social messaging apps (31%).
Let’s talk about AI impact in more detail.
What’s the role of AI in email marketing?
The majority of marketers (96%) claim that AI has had a positive impact on their overall email marketing performance.
About 72% of them agree that AI and automation tools help them personalize the experience customers get with their company.
Other common goals for using AI are:
- email retargeting (55%)
- subject line optimization (44%),
- dynamic content generation (42%), and
- automated segmentation (40%).
Key takeaways:
Automation will be a total must-have in 2026, as it boosts conversions incredibly. The top trend will remain AI-driven email marketing. Consider using AI-powered tools that would streamline and personalize your campaigns, giving you a solid competitive advantage.
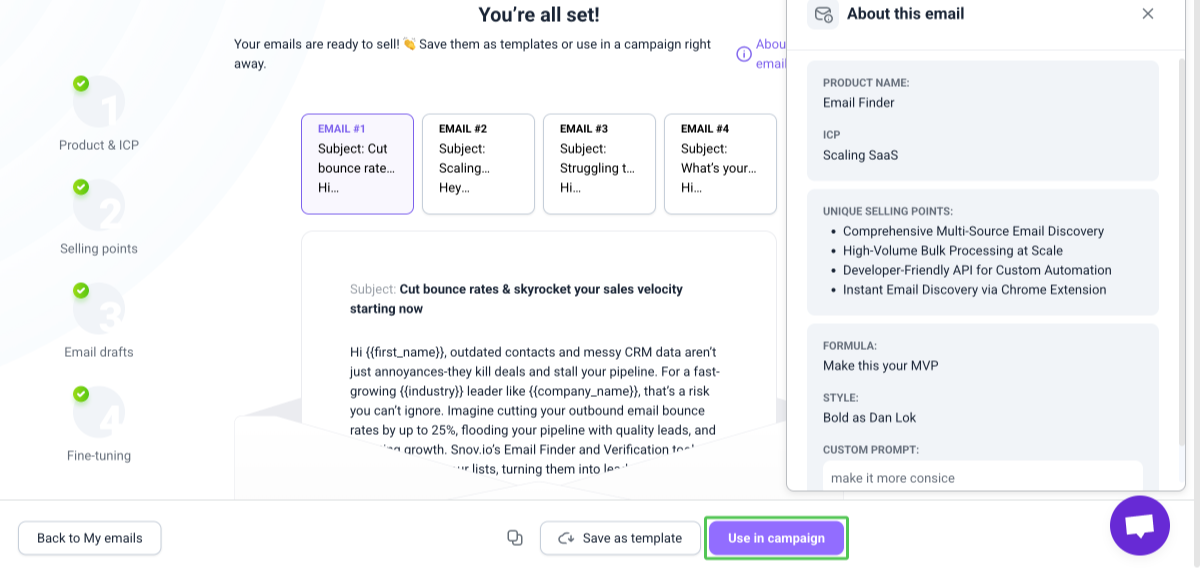
For instance, with AI Studio from Snov.io, you’ll be able to tailor messages based on your product’s strengths and your ideal customer’s unique needs.
Here’s how:
Simply select your product and target audience to generate 10 data-backed selling points based on your ICP’s real challenges. Choose one, and get 5 email drafts ready to edit, save as templates, or use in your campaign. Scale outreach, stay relevant, and boost reply rates without either writing from scratch or losing a human touch.
Segmentation and personalization statistics
Let’s look more closely at how personalized emails impact customers’ willingness to engage with the business and stay loyal.
About 78% of customers admit that they would engage with a message tailored to their interests. That promises higher engagement than an exclusive VIP offer or even a new product announcement would yield!
People notice when messages lack personalization. Messages with irrelevant content or offers frustrate over 50% of customers, and 41% are disappointed when a campaign doesn’t reflect their wants and needs.
Not a surprise, 55% of marketers want to expand their personalization strategies for the upcoming years.
As for segmentation, almost all professionals (90%) agree that it is one of those key best practices that can boost email performance.
Key takeaways:
Email segmentation and personalization remain the best tactics. Look for the tools that help you streamline bulk messaging without compromising advanced contact segmentation and email personalization.
For instance, with a sentiment analysis tool from Snov.io, you can screen your prospects’ behavior and determine if they are interested in your offer. This information will help you launch targeted campaigns based on the needs of each segment.
A common case study:
You spot the most interested prospects and send them a demo link. For neutrals, you provide more information about a product, while those who appear not really interested get re-engagement campaigns with a compelling offer. Looks like a clever strategy, doesn’t it?
Subject line, body, and signature in email marketing
Writing a perfect email copy is essential for getting your prospect to even read your message. For instance, 43% of people open emails based on the subject line.
How long should a subject line be?
Statistics show that 61-70 character-long subject lines generate the highest open rate (43.38%), followed by:
- 21-30 characters (43%);
- 31-40 characters (42%);
- 11-21 characters (42%).
But keep in mind that your subject lines should be mobile-friendly. The iPhone, for example, cuts off the subject lines over 32 characters.
Do personalized subject lines perform better?
Interestingly, but in 2025, non-personalized subject lines show higher open rates than those that marketers tried to personalize (41.87% against 35.78%).
Believe it or not, but CTR of non-personalized subject lines almost doubles the personalized counterparts (4.23% against 2.11%)
How long should your email be?
The most recent studies haven’t found any correlation between email length and engagement. Most recipients (67%) prefer shorter emails, though according to 27% of them, how long a message is is not so relevant as how compelling it looks.
What it means for email copywriters is that subscribers won’t really count how many words your copy is. What matters is how professionally you wrote it. Email signature plays one of the key parts here.
Why use a signature in email?
The top reasons why marketers use an email signature are that they believe it:
- contributes to a professional first impression (77.3%)
- increases brand awareness (56.4%)
- helps build trust (33.1%).
Besides, signatures increase social media engagement (16%) and improve marketing activities (9%).
What to include in email signature?
According to statistics, name (94.5%), business website (91.2%), and company name (88.4%) are the elements every signature should comprise. They are followed by a phone number and an email address (84% and 83.4% respectively).
Key takeaways:
- Ensure your subject line is no longer than 70 characters. Try to make it relevant to recipients. Calling someone by name doesn’t work as a nice personalization hack anymore. Instead, focus on deeper and more advanced personalization by researching subscribers’ interests, company information, etc.
- In 2025 and 2026, email length is not so important as the value your campaigns bring. If you have doubts, do some A/B testing to see which length brings you more engagement.
- Remember to crown your emails with a professional signature. It shouldn’t necessarily be long. Remember about the holy trinity — adding your name, company, and its website. Adding other elements such as email address, job position, social links, and a headshot can be your area of experimentation.
→ In this article, you may find inspiring email signature examples for your messages.
Does visual content in email campaigns boost engagement?
It all depends on how you use them in your emails, of course. Let’s dive deeper into the core visual elements that marketers normally use in their campaigns, starting with images.
Should you use images in emails?
It looks like images are quite okay for marketing campaigns. Based on the latest data, emails with graphics show an average higher open and click-through rate (43.12% and 4.84%), compared to those that don’t feature any graphics (35.79% and 1.64% respectively).
As for the unsubscribe and spam rates, they remain similar for both types (0.15% and 0.01%, respectively).
Bounce rates are a bit higher for graphic-including messages than those without any – 2.42% against 2.36%.
For cold emails, however, the situation is a bit different. If you deal with cold sales outreach, adding links, images, or attachments won’t bring you higher engagement. On the contrary, based on the research we’ve conducted at Snov.io, plain emails have a 0.22% higher open rate.
Now, let’s take a look at one of the most controversial points — emojis.
Are emojis ok in work emails?
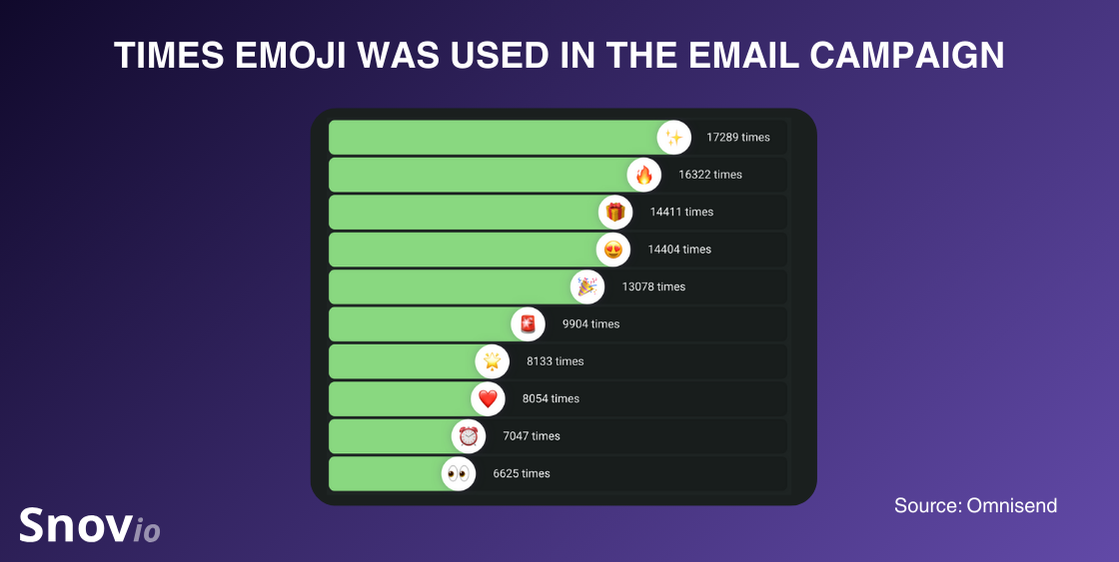
Overall, businesses tend to use emojis in 40.1% of email campaigns. As stats show, marketing messages without emojis bring higher open rates (17,9%) and click rates (3,1%) compared to messages where some emojis have been included (16,9% and 2,7% respectively).
What about embedding videos?
Are videos good for email marketing?
Yes, if you know how to use them smartly. Stats reveal that 87% of people are ready to buy a product or service right after watching a video. Not bad, right?
That’s why more than 50% of marketers already connect their video platform to their email marketing tool.
To make videos bring you desired conversions, you should also consider their length. The data shows that videos between 30 seconds and 2 minutes are most effective.
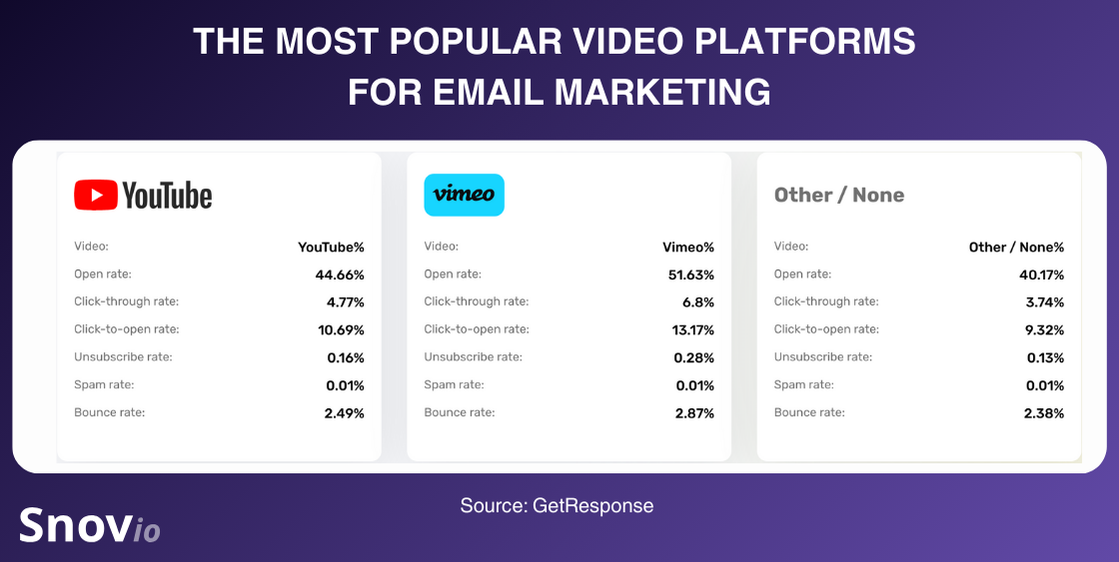
While embedding videos in your emails, opt for those hosted on YouTube or Vimeo – according to statistics, they drive the most engagement.
Key takeaways:
- Marketing emails favor using images. Just ensure you do it smartly. I advise you to keep the text-to-image ratio in emails at 4:1. This will still attract the attention of people who want to see pictures in their marketing communications but won’t annoy those who don’t.
- For cold outreach marketers, however, I recommend being more modest while using images, attachments, and links.
- As for emojis, I would advise that you study your audience first. Then you can segment subscribers into those who’d love seeing emojis in your campaigns and those who prefer messages looking more formal.
- Don’t be shy to experiment with short videos, especially if they highlight your product or service benefits. But elaborate on the technical side, so videos could be displayed in your messages the right way.
→ Here’s a quick guide on how to embed videos into your email content.
Desktop and mobile optimization statistics
Lots of marketers still underestimate the importance of mobile optimization. Nearly 1 in 5 email campaigns isn’t mobile-friendly!
Meanwhile, about 64% of recipients check their email on mobile. The remaining 36% use desktops.
Key takeaways:
As you can see, data confirms that mobile optimization is vital to the success of your email marketing campaign.
To ensure your messages are displayed correctly on mobile devices, I recommend:
- shortening your subject line text to 40 characters
- using a single-column layout
- using 22pt font for headlines and 14pt font for body text
- adding alt-text to images
Besides, try to make CTAs more prominent so they look bigger and easier to click; for example, by turning them into buttons.
2025 and beyond: trends and forecasts
I recommend considering the following trends and predictions while crafting your future-proof email marketing strategy:
- New markets will open and grow. For example, India and Nigeria will account for 28% of new users in 2030. Keep an eye out for opportunities there.
- Aging populations will use digital communication more frequently. Take them into account while figuring out your message, tone of voice, and outreach channels.
- Security innovations, such as AI-filtering, are likely to reduce spam and phishing threats significantly by 2030. Make sure your campaigns won’t end up in spam.
- Internet users will expect brands to communicate with them via their preferred channel.
Today, only 24% of companies have email integrated with other means of communication. This is highly concerning because companies running multi-channel campaigns see a 31% growth in leads compared to single-channel users.
This number is only expected to grow by 2030, so it’s time to rethink your marketing approach to incorporate more touchpoints.
Key takeaways
Were our email marketing stats fascinating? Hope so. Will they be helpful in 2026? Absolutely, if applied strategically to boost your lead gen and outreach efforts.
After analyzing the above insights, I can highlight five essential strategies for email marketing success:
- If you didn’t get a reply to your first two emails, it’s better to hold off on your next attempts.
- Be transparent, get straight to the point, and provide real value in your interactions.
- Learn as much as you can about your audience, and carefully segment it before launching an outreach campaign.
- Choose reliable software that will automate your marketing processes, but keep your messaging human.
- Integrate your major outreach channels with each other to achieve consistent cross-platform messaging.
Sounds like a lot of work? The good news is, your Snov.io account contains all the tools you need to accomplish these. From deliverability checks to AI-enhanced prospect segmentation and multichannel outreach – we’ve got it all.
Try our advanced automation tools for free today and enjoy your success with less effort and more impact.
Sources used:
- https://ascend2.com/wp-content/uploads/2023/07/Email-Marketing-and-AI-2023-230724.pdf
- https://ascend2.com/wp-content/uploads/2024/05/The-State-of-Email-and-Automation-in-2024-Report-May-2024.pdf
- https://belkins.io/blog/cold-email-response-rates
- https://www.hubspot.com/state-of-marketing
- https://hunter.io/the-state-of-cold-email#personalization
- https://www.getresponse.com/resources/reports/email–marketing-benchmarks
- https://go.cmgroup.com/hubfs/2024%20Consumer%20Trends%20Index/2024_Marigold%20Global%20Consumer%20Trends%20Index.pdf?
- https://www.linkedin.com/feed/update/urn:li:activity:7354565366758436864/
- https://www.litmus.com/wp-content/uploads/pdf/The-2023-State-of-Email-Workflows-Report.pdf
- https://www.litmus.com/wp-content/uploads/pdf/The-2024-State-of-Email-Trends.pdf
- https://www.litmus.com/resources/state-of-email-lifecycle-marketing
- https://www.litmus.com/blog/infographic-the-roi-of-email-marketing
- https://mailchimp.com/resources/email–marketing-benchmarks/
- https://www.mailgun.com/blog/it-and-engineering/infrastructure-black-friday/#chapter-3
- https://newoldstamp.com/the-state-of-marketing-report-2024.pdf
- https://www.omnisend.com/2025-ecommerce-marketing-report/
- https://www.omnisend.com/email-fun-facts-year-in-review-2024/
- https://www.sagefrog.com/resources/2023-b2b-marketing-mix-report/
- https://selzy.com/en/benchmarks/emoji-research/
- https://sopro.io/resources/whitepapers/the-state-of-prospecting-25/
- https://www.superoffice.com/blog/b2b-email-marketing-report/
- https://wistia.com/learn/marketing/video-marketing-statistics
- https://wyzowl.com/video-marketing-statistics/
- https://www.zerobounce.net/email-statistics-report/


